.svg)

This week the U.S. Securities and Exchange Commission sued the founder of bankrupt subprime auto lender Tricolor Holdings and two of its executives, accusing them of double pledging collateral and misrepresenting the debt pools they were offering to lenders.1 From an investor perspective, Tricolor was particularly painful as instruments rated at “AAA” and “AA” are in default. For both Tricolor2 and First Brands Group,3 recoveries are likely to be minimal. Egan-Jones did not rate either firm or their securities and, as reflected in our historical results, our performance record continues to be strong (see Appendix A for our whitepaper).
Some claim that there was fraud and therefore the collapse was not predictable. A contrary view is that there is often fraud and that sophisticated investors and risk managers would be well served to examine some of those signs. Obligors mask the true conditions in an attempt to “fake it until they make it”. Regardless, it is worthwhile revisiting some early indicators.
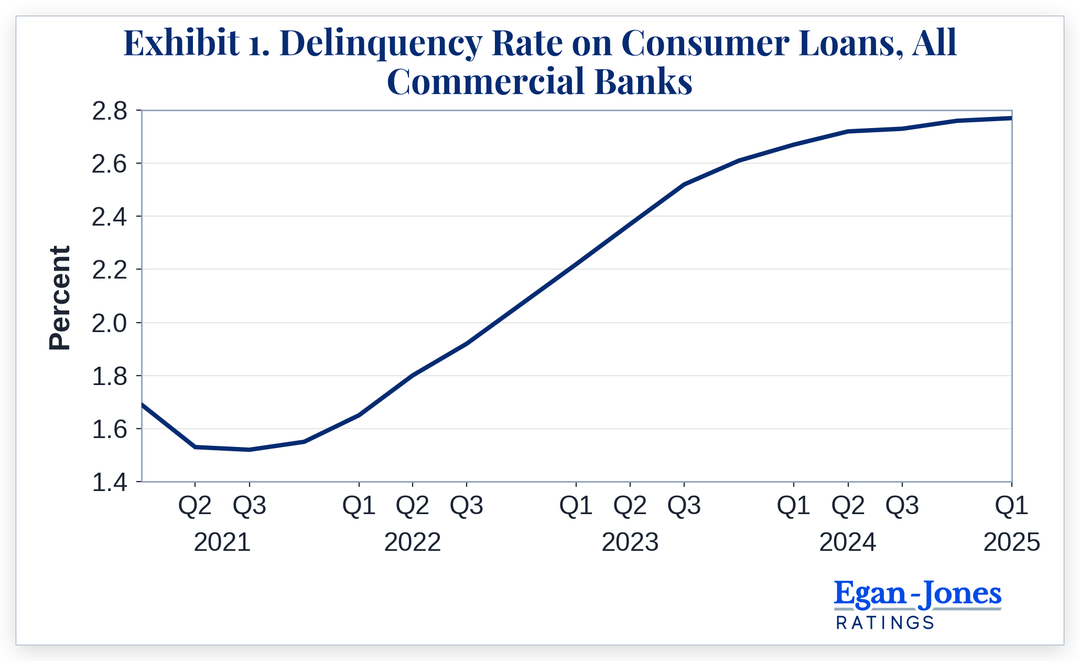
For Tricolor, the business was heading in the wrong direction as the credit quality of obligors was weakening while the value of collateral had become increasingly suspect. In the case of the obligors (i.e., the lessees and auto purchasers), which were typically weaker credits, they have been hit with immigration enforcement, inflation, and a weaker employment market. As can be seen below, the delinquency rate on all consumer loans jumped from approximately 1.5% in early 2021 to 2.8% in late 2024; surely it was significantly greater for subprime borrowers, which was Tricolor’s customer base.
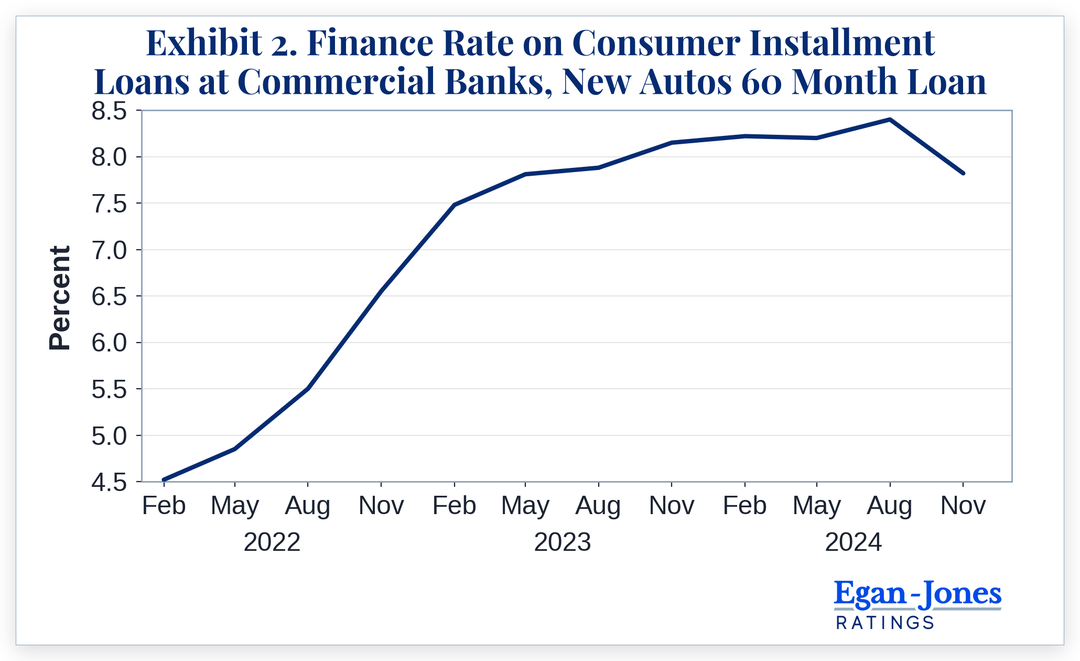
Meanwhile, the cost of financings leapt from 4.5% in early 2022 to a high of 8.4% in 2024.
Lastly, the value of Tricolor’s collateral was collapsing as shown by the below diagram:
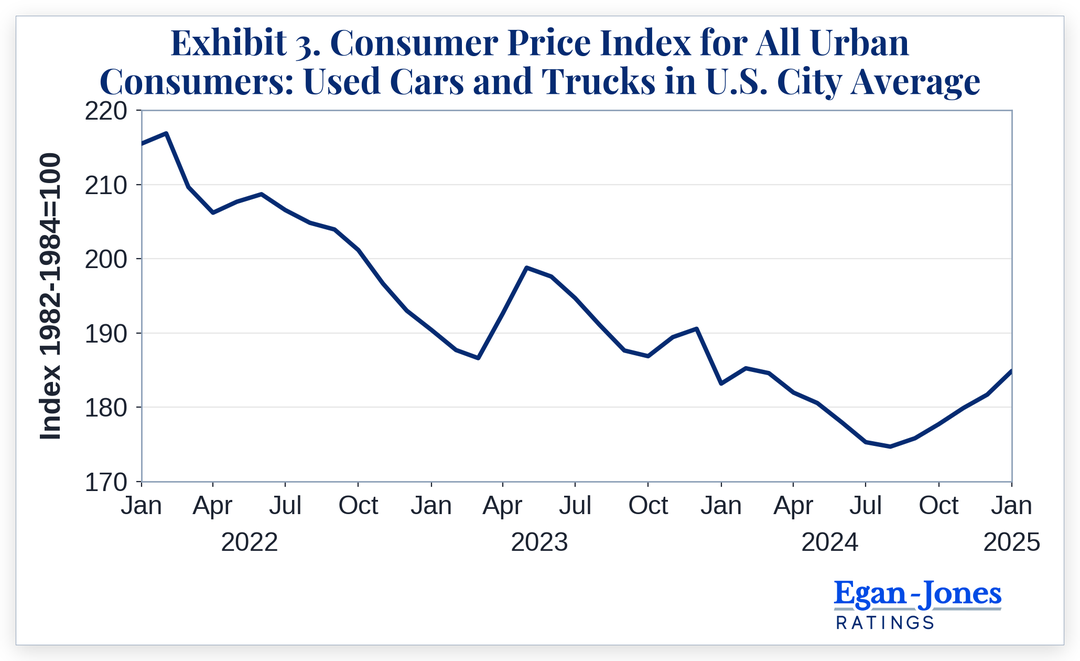
So, there you have it, a triple whammy:
While none of this is definitive, certainly these signs warrant additional due diligence.
The appropriate measure of a credit rating is how it performs over time. The attachment provides support for our superior performance.
Our view is that credit quality shifts can often be identified through observable indicators. We were fortunate in flagging Enron and WorldCom and being named number one by Fortune Magazine for warning about the 2008 Credit Crisis.4 We aim to continue providing timely, accurate ratings.
Egan-Jones Ratings was founded at the request of major institutional investors to provide timely and independent credit ratings. The information below presents one measure of Egan-Jones’ historical ratings performance.
Egan-Jones Ratings Company delivers global credit ratings for corporate debt, real estate, insurance, financial institutions, and alternative assets. Egan-Jones rates a variety of unsecured and collateralized instruments, such as those backed by receivables, land, consumer debt, litigation settlements, inventory, leases, equipment, commodities, royalties, intellectual property, and other assets. Investment vehicles such as feeder and master funds are also rated by Egan-Jones.
Egan-Jones Ratings has achieved broad and wide acceptance among domestic life insurance groups and companies. 49 of the top 50 groups / companies hold private placements or other solicited instruments rated by Egan-Jones.5,6
Hence, a rating of solicited debt from Egan-Jones is likely to be widely accepted by domestic life insurance companies.
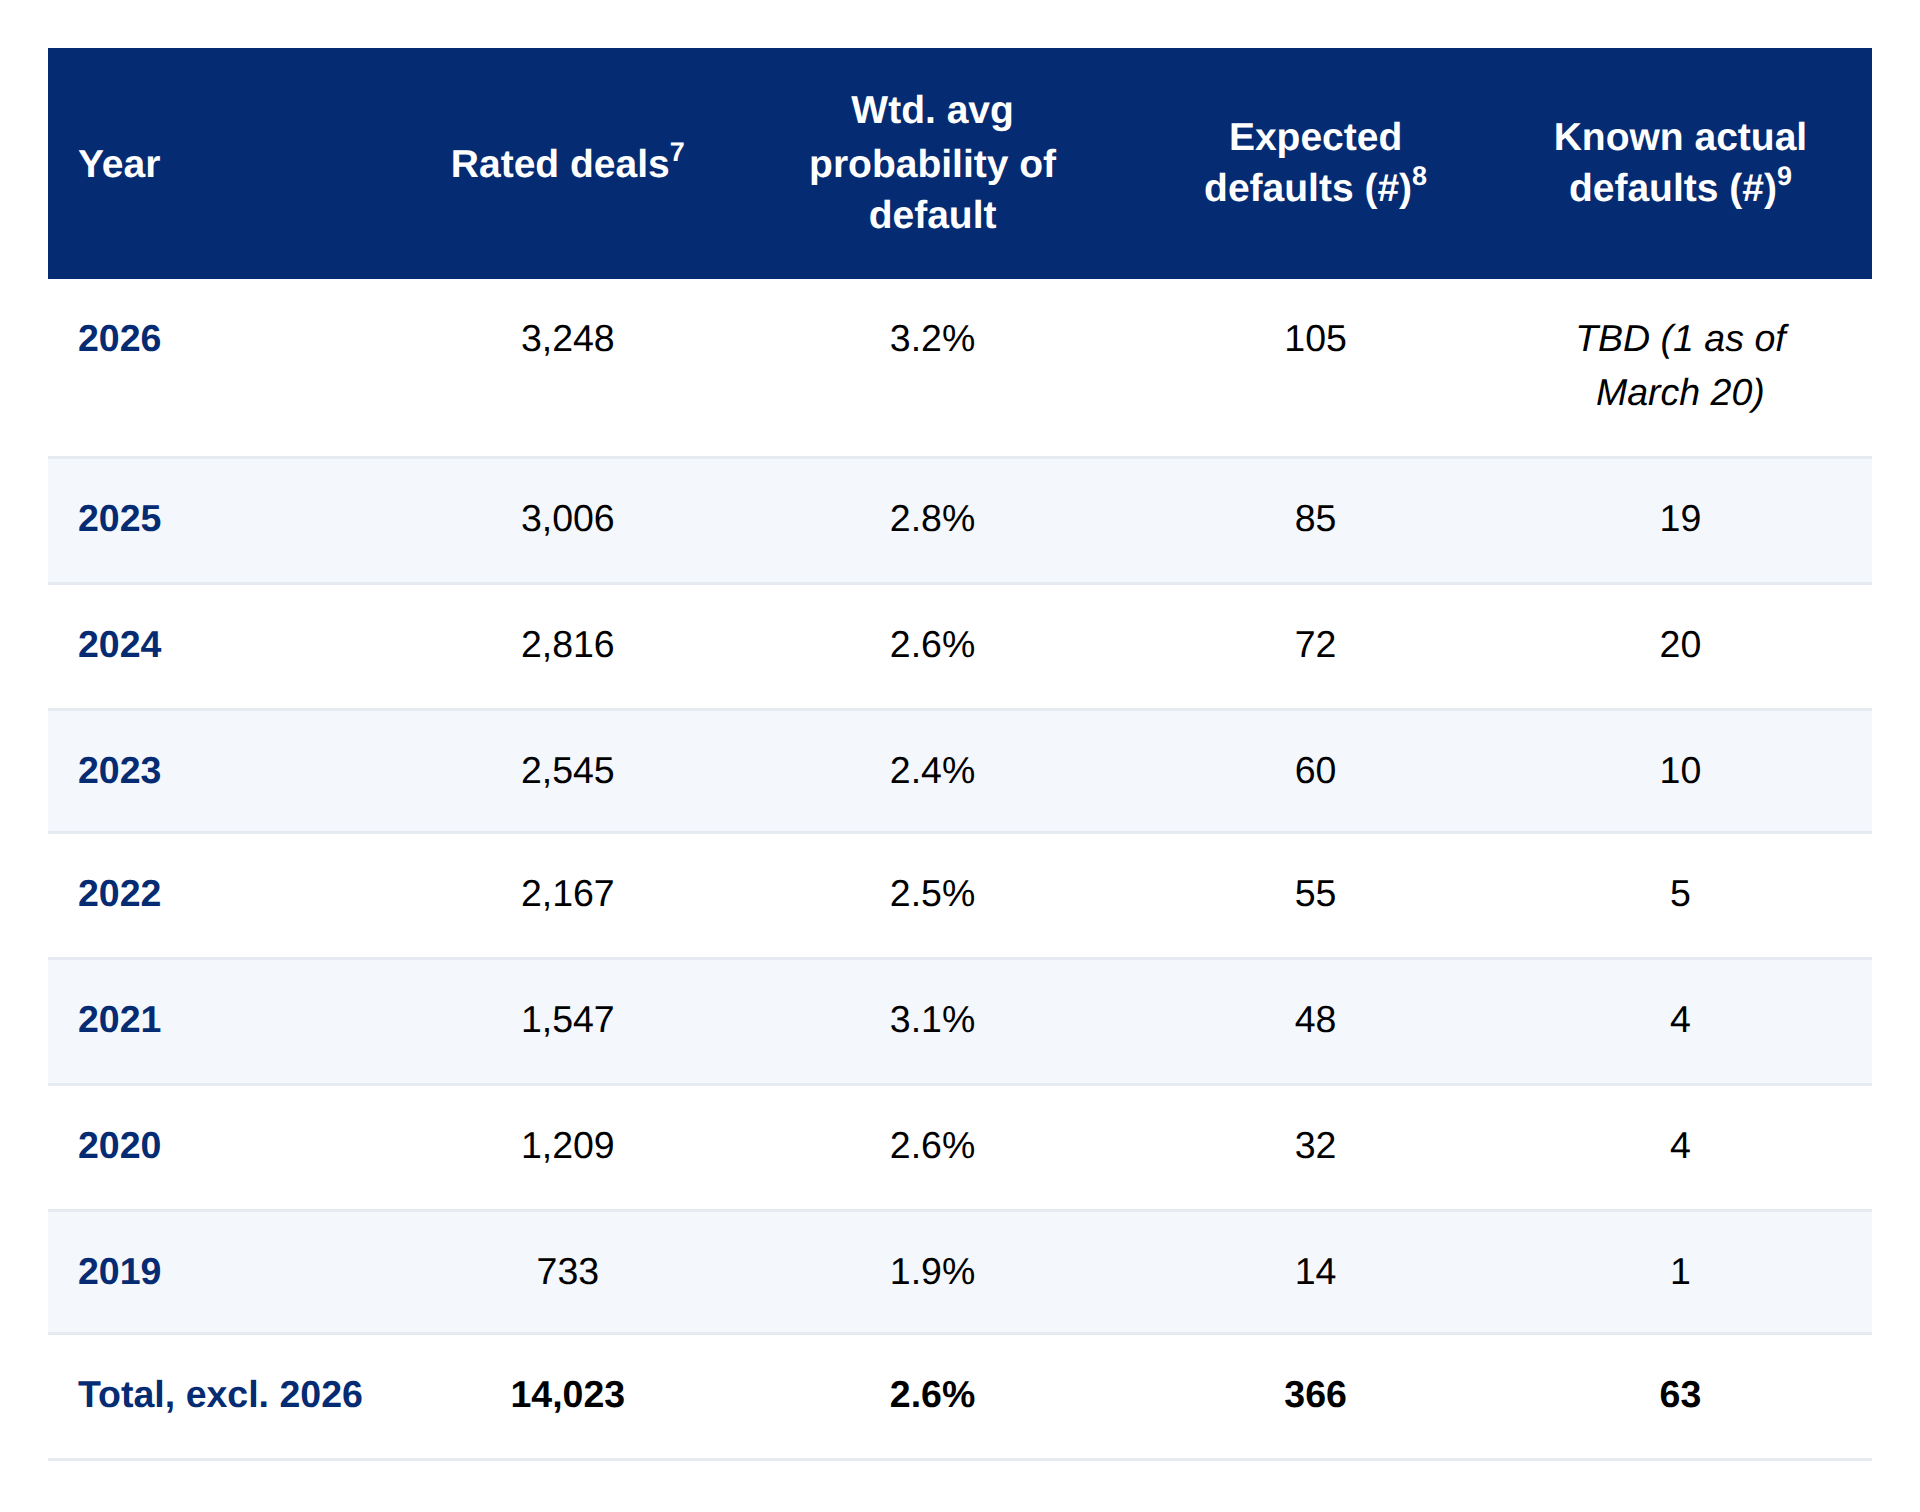
Egan-Jones’ solicited debt ratings have outperformed expectations. Each rating has an embedded probability of default within the next 12 months. Multiplying the number of outstanding ratings by each rating’s probability of default yields the expected number of defaults.
For example, if an investor holds 10 instruments for which the implied probability of default is 10%, 1 default would be expected in the next 12 months (i.e., 10 instruments x 10% PD = 1).
Egan-Jones’ unsolicited ratings were similar to those of one of the two legacy rating agencies in 2025, within 0.07 notches (weighted average) for the 1,138 issuers rated by both Egan-Jones and that agency. The other legacy rating agency had an equal or higher rating relative to Egan-Jones, 63.5% of the time.
A study by the European Securities and Markets Authority (ESMA) determined no notching was needed for Egan-Jones’ ratings.10 A June 2022 Morgan Stanley study determined one of the legacy rating agencies had higher default rates than Egan-Jones.
The ten most recent Egan-Jones CLO tranche ratings are shown below alongside the other NRSRO’s equivalent rating on the same tranche and the current collateral test cushions.
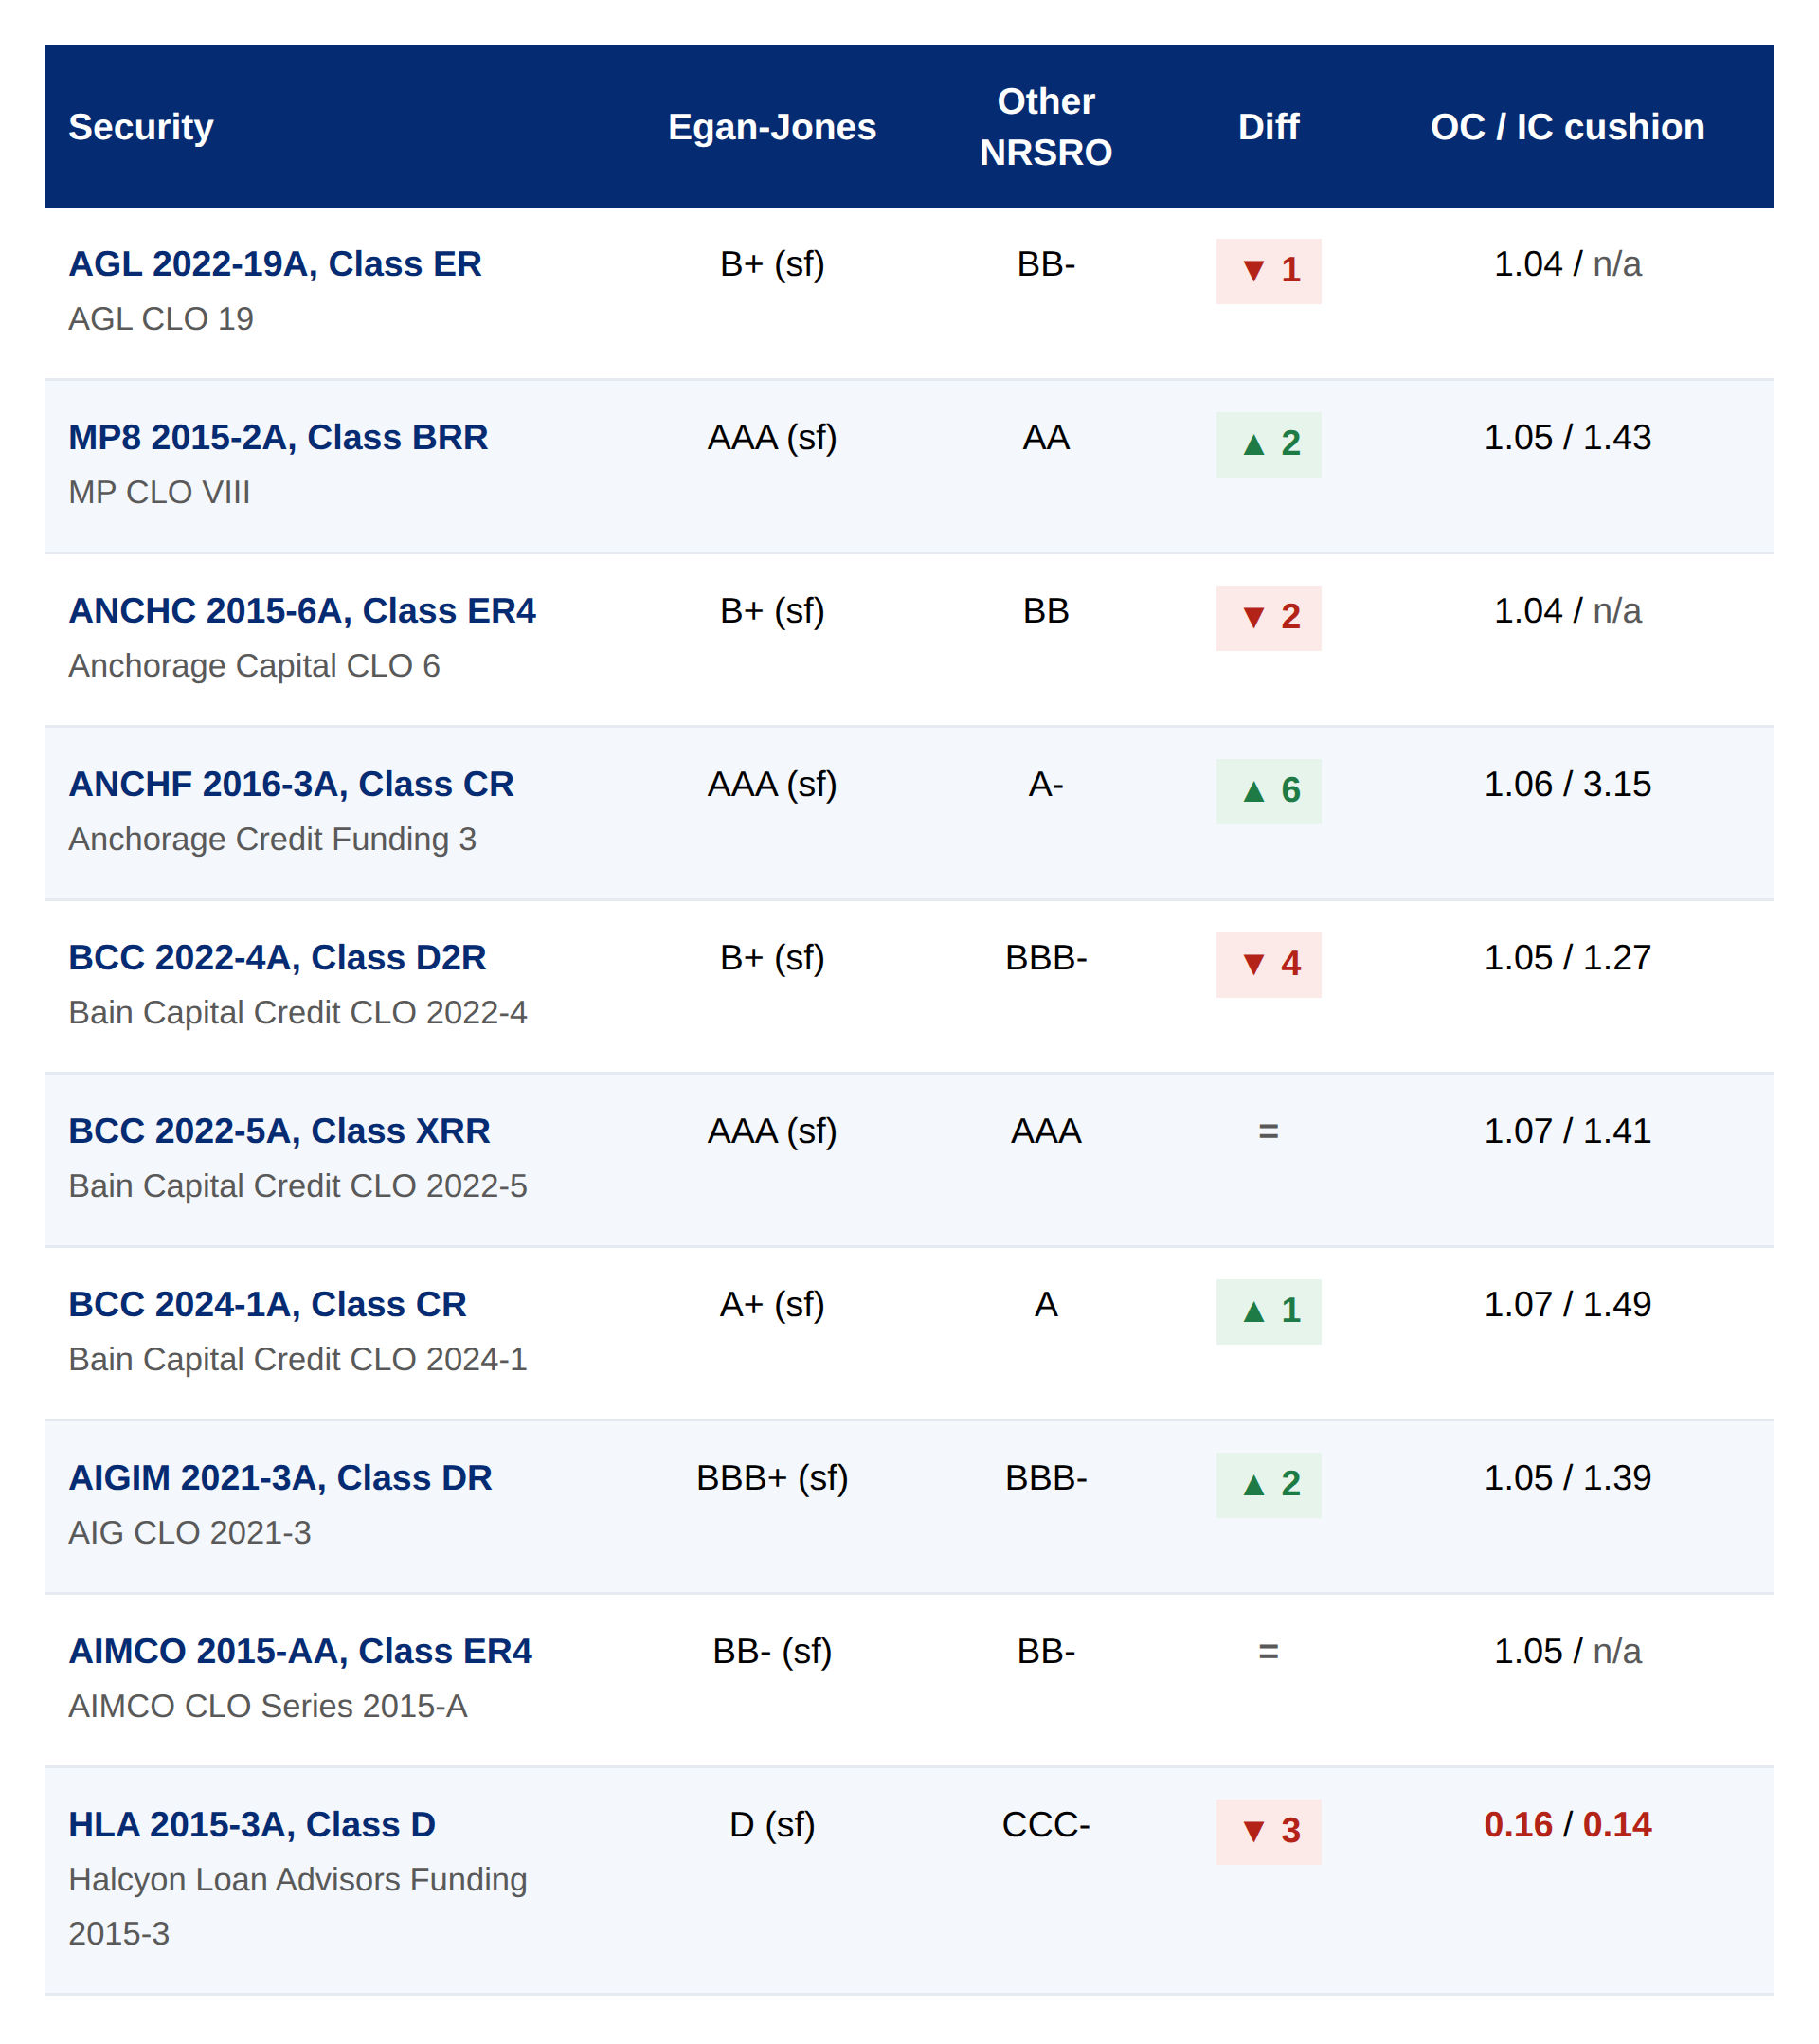
Diff is the gap in notches between the Egan-Jones rating and the other NRSRO’s equivalent rating on the same tranche. Green is Egan-Jones higher; red is Egan-Jones lower. Cushion is the current test level divided by its trigger, so a figure below 1.00 means the test is failing. “n/a” appears where the report shows no interest coverage test for that class. Egan-Jones ratings shown here are not NRSRO ratings.
Additional Sources


.jpg)