Suffering from Success: Poor Chinese Equity Returns
China outgrew the US, but competition handed the gains to workers and customers, not shareholders.
Published on
October 22, 2026
Economic Health, Defined
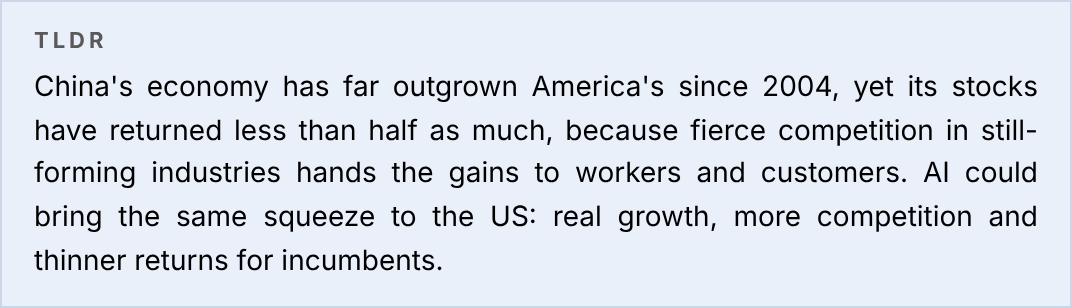
Wealth is poorly defined by GDP alone, as it is poorly defined by equity valuations alone. China scores high on the first and low on the second. The US scores well on both.
Sources: World Bank; Yahoo Finance (FXI, VTI); WorldPERatio; Aswath Damodaran, NYU Stern (January 2026); National Bureau of Statistics of China; US Social Security Administration. Details in the exhibits below.
I. Overview
China's growth was significant, and competition handed most of it to workers and customers.
Our premise is that Chinese companies have sought market share over profit, particularly in novel industries, from electric vehicles to food delivery, thus depressing shareholder returns. Dozens of well-funded rivals fight over each one, and the profits get competed away.
II. Growth Without Gains
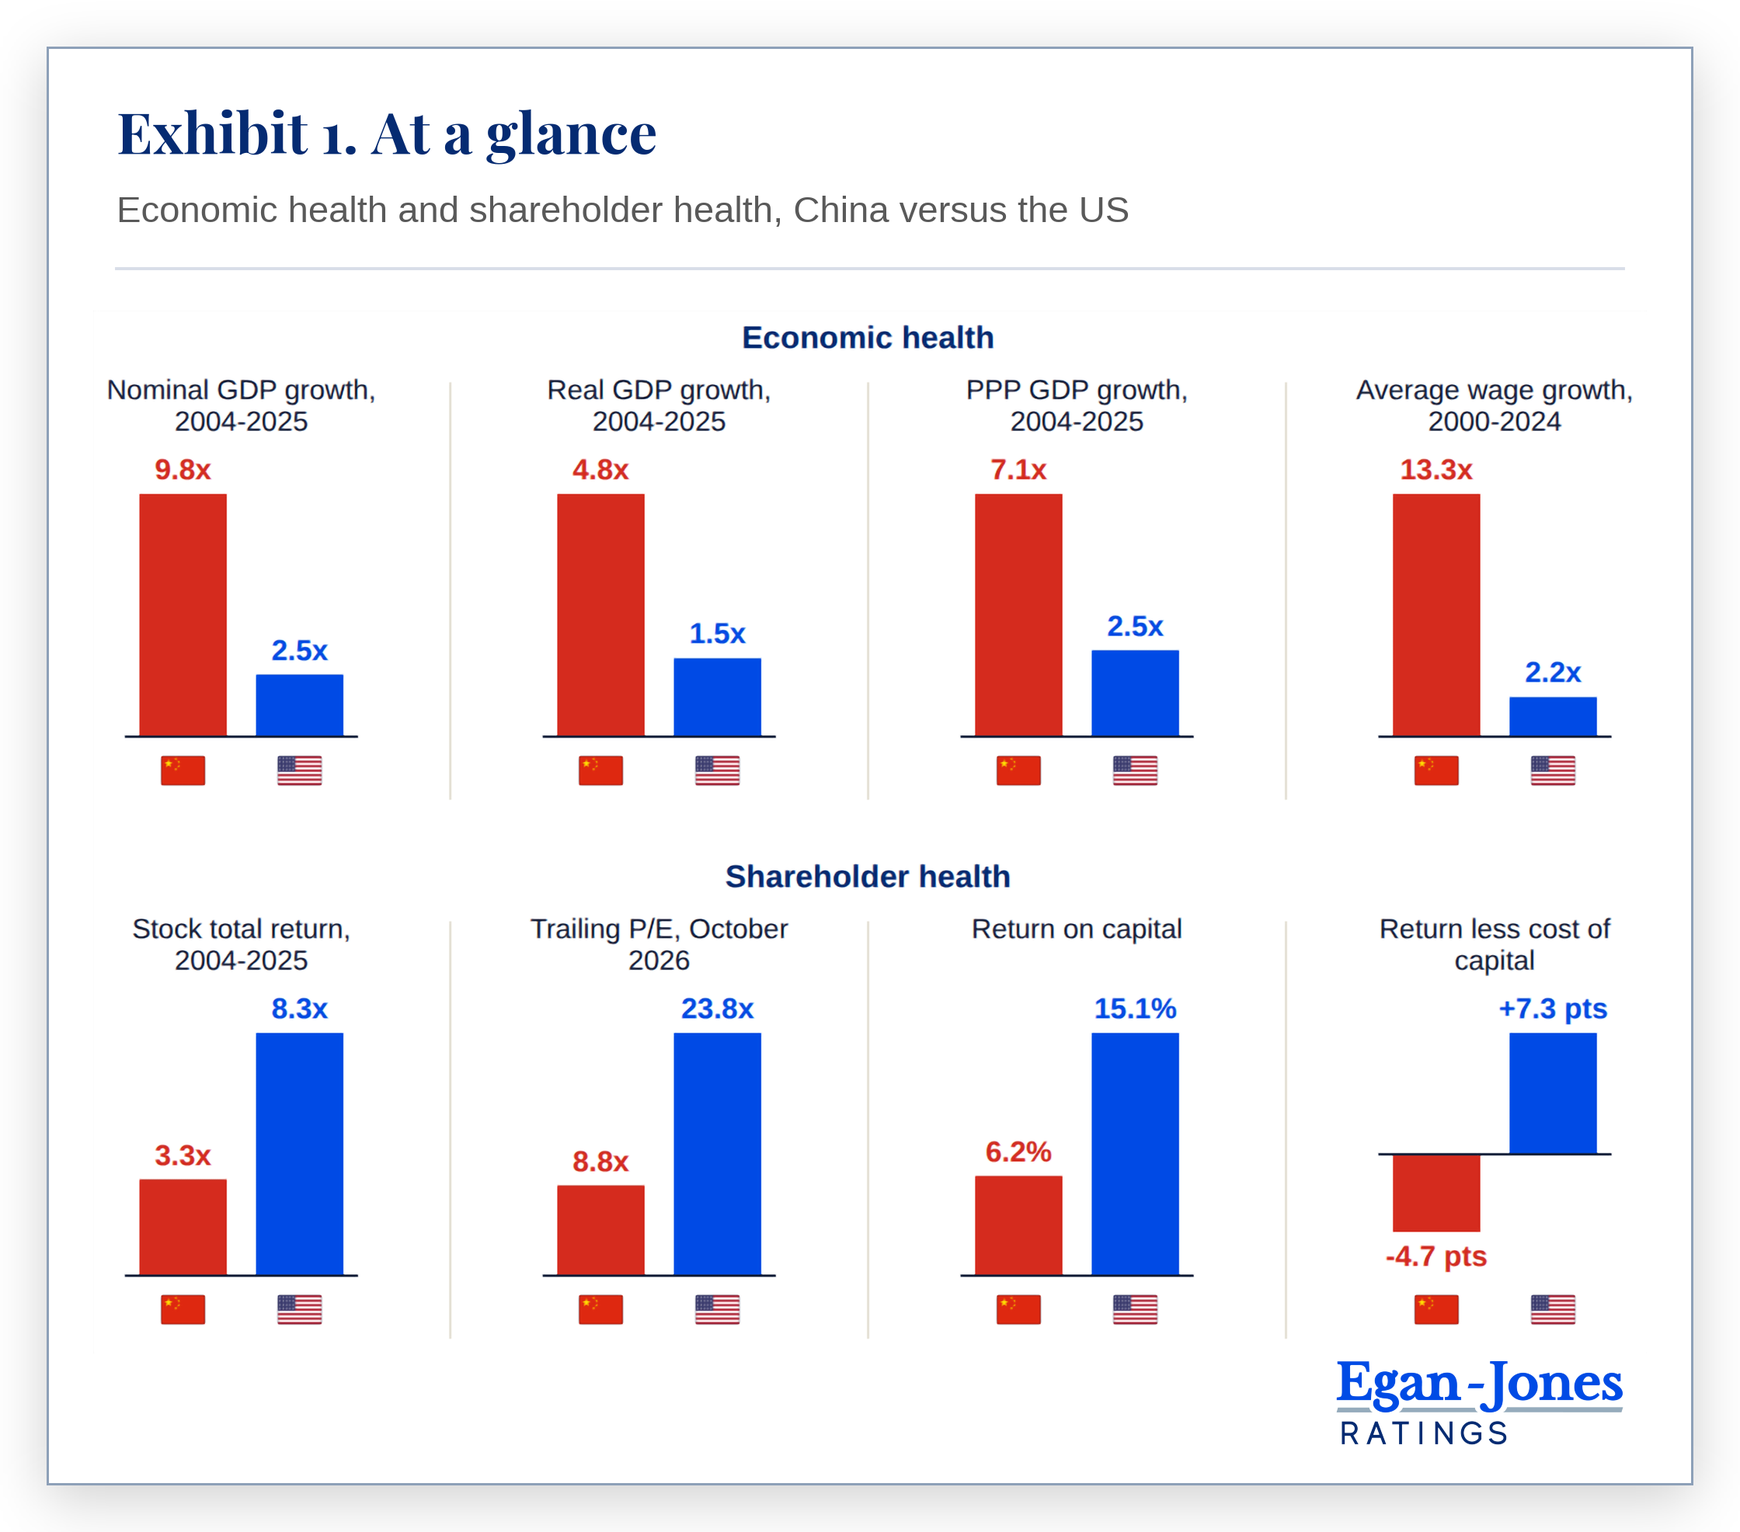
On every measure, China's economy outgrew America's; its stocks returned less than half as much.
The economy - whether measured in dollars, after inflation or at purchasing power parity, China grew at least twice as much as the US from 2004 to 2025 (Exhibit 2).1
Purchasing power - at purchasing power parity, China's economy passed America's in 2014 and is now about a third larger.1
The stock market - FXI, the iShares China Large-Cap ETF, returned less than half what VTI, the US total market, delivered over the same years, dividends included.2
The long wait - an investor who bought FXI at the end of October 2007 is still down about 27%.
Source: World Bank (GDP in current US$, and at purchasing power parity in current international $); Yahoo Finance (FXI and VTI adjusted closes, December 2004 to December 2025).
This is an old pattern. Jay Ritter of the University of Florida found that over 1900-2002 the correlation across countries between real stock returns and growth in per capita GDP was negative.3 Growth built on more capital and more workers raises output without necessarily raising the return on that capital.
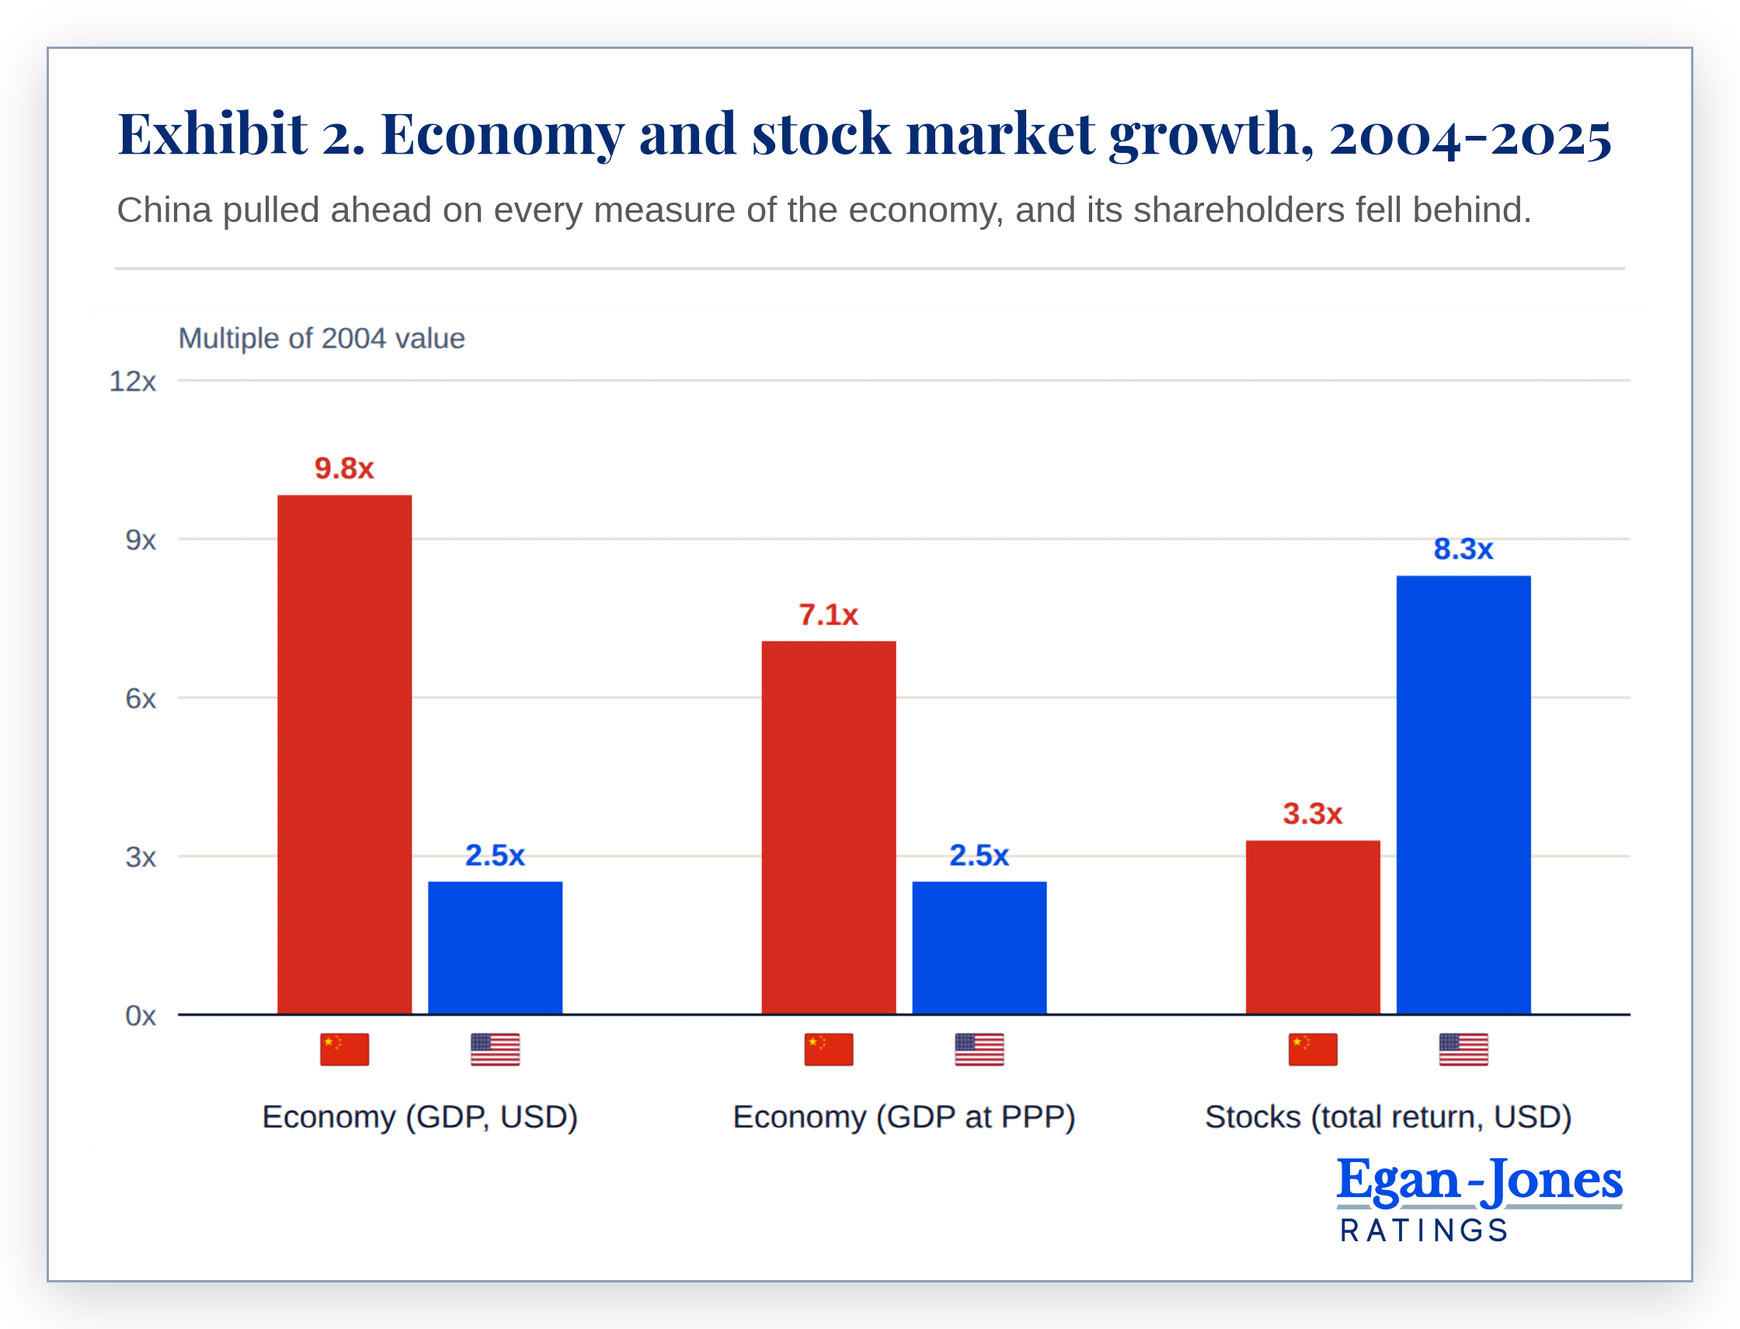
Valuation - China's large caps trade at little more than a third of the US multiple, and China has been the cheaper market in every month since 2011 (Exhibit 3).4
What the multiple says - a P/E that low reads as a forecast that today's profits will be competed away. Further, it reflects concerns of those considering investment in China that geopolitical tension may strip them of their Chinese holdings. This stripping could happen either by (1) Chinese pressure or (2) home country pressure.
China pressure - one could imagine that China could replay the western playbook whereby western countries froze Russian "oligarch" assets as a result of the Russia-Ukraine war.
Home country pressure - one already saw pressure from the US government through tariffs and other means to reshore Western investments in China.
The 2025 rally faded - the Hang Seng rose 28% and the CSI 300 18% in 2025.5 Over the past twelve months, MCHI fell 18% while VTI gained 17%.2
2026 so far - Hong Kong-listed Chinese shares entered a bear market in June on weak consumer spending and fading confidence in e-commerce names.6 They slipped again in late September as investors doubted the Trump-Xi summit would yield more than a two-month extension of the trade truce.7
Source: WorldPERatio.com, monthly trailing P/E of the FXI and VTI ETFs, January 2005 to October 2026.
III. Too Many Cooks
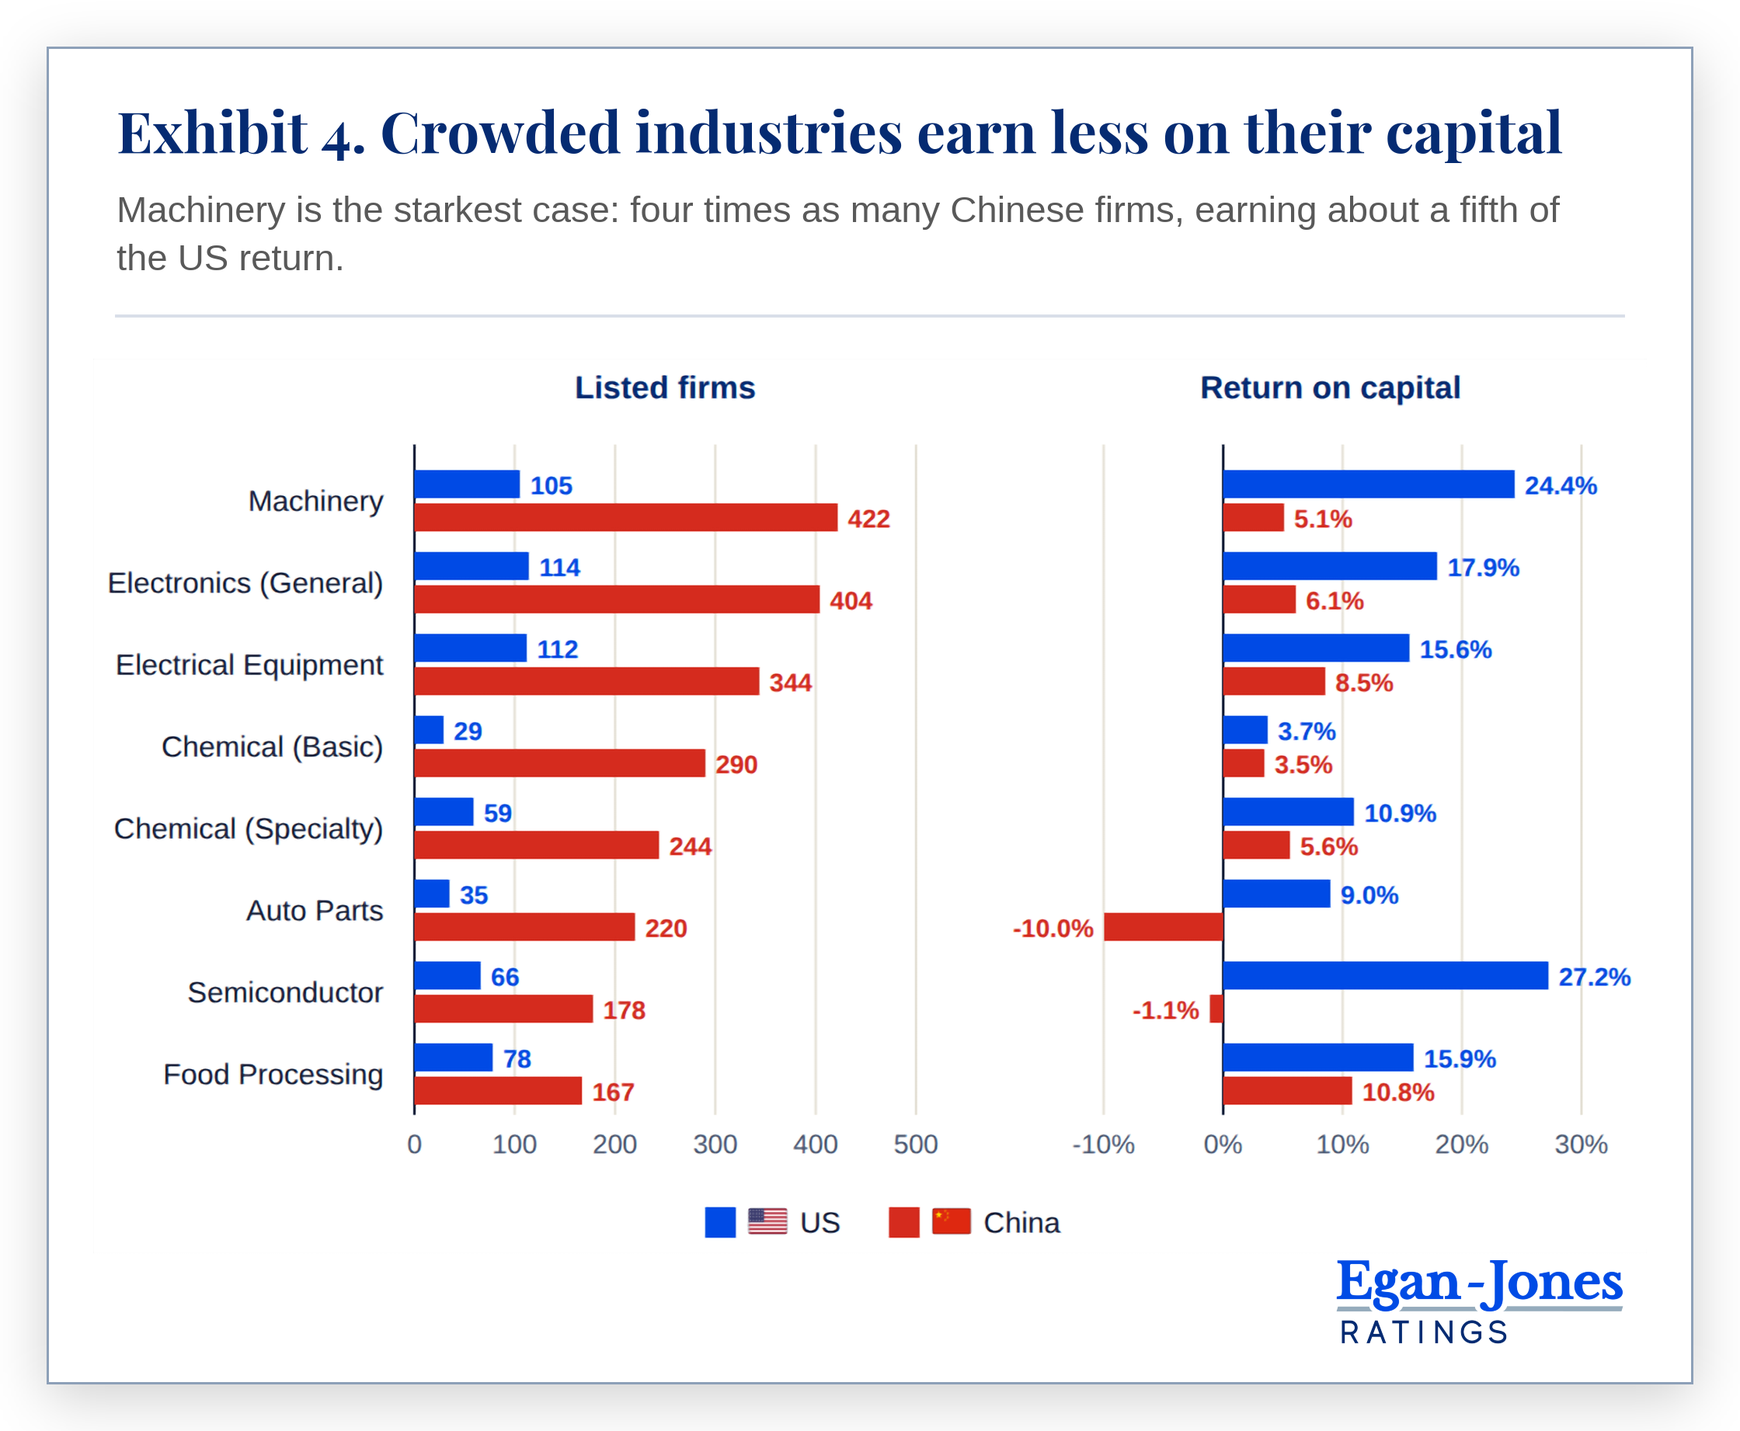
Chinese companies earn less than their capital costs; US companies earn more.
Return on capital - China's listed non-financial companies appear to earn less than half the US return on each dollar of capital.8
The pattern - in 21 of the 24 industries where China has at least twice as many listed firms, Chinese companies earn the lower return on capital.
Chinese officials have a name for the result: neijuan, or involution, a contest in which every firm works harder and none gets ahead. Since 2025, ministries and industry groups have pressed companies to end what they call disorderly price wars.9
Source: Aswath Damodaran, NYU Stern, January 2026. The eight largest industries by Chinese firm count where China has at least twice as many listed firms as the US. Return on capital is after-tax operating income divided by invested capital, aggregated across firms.
IV. The Car Lot
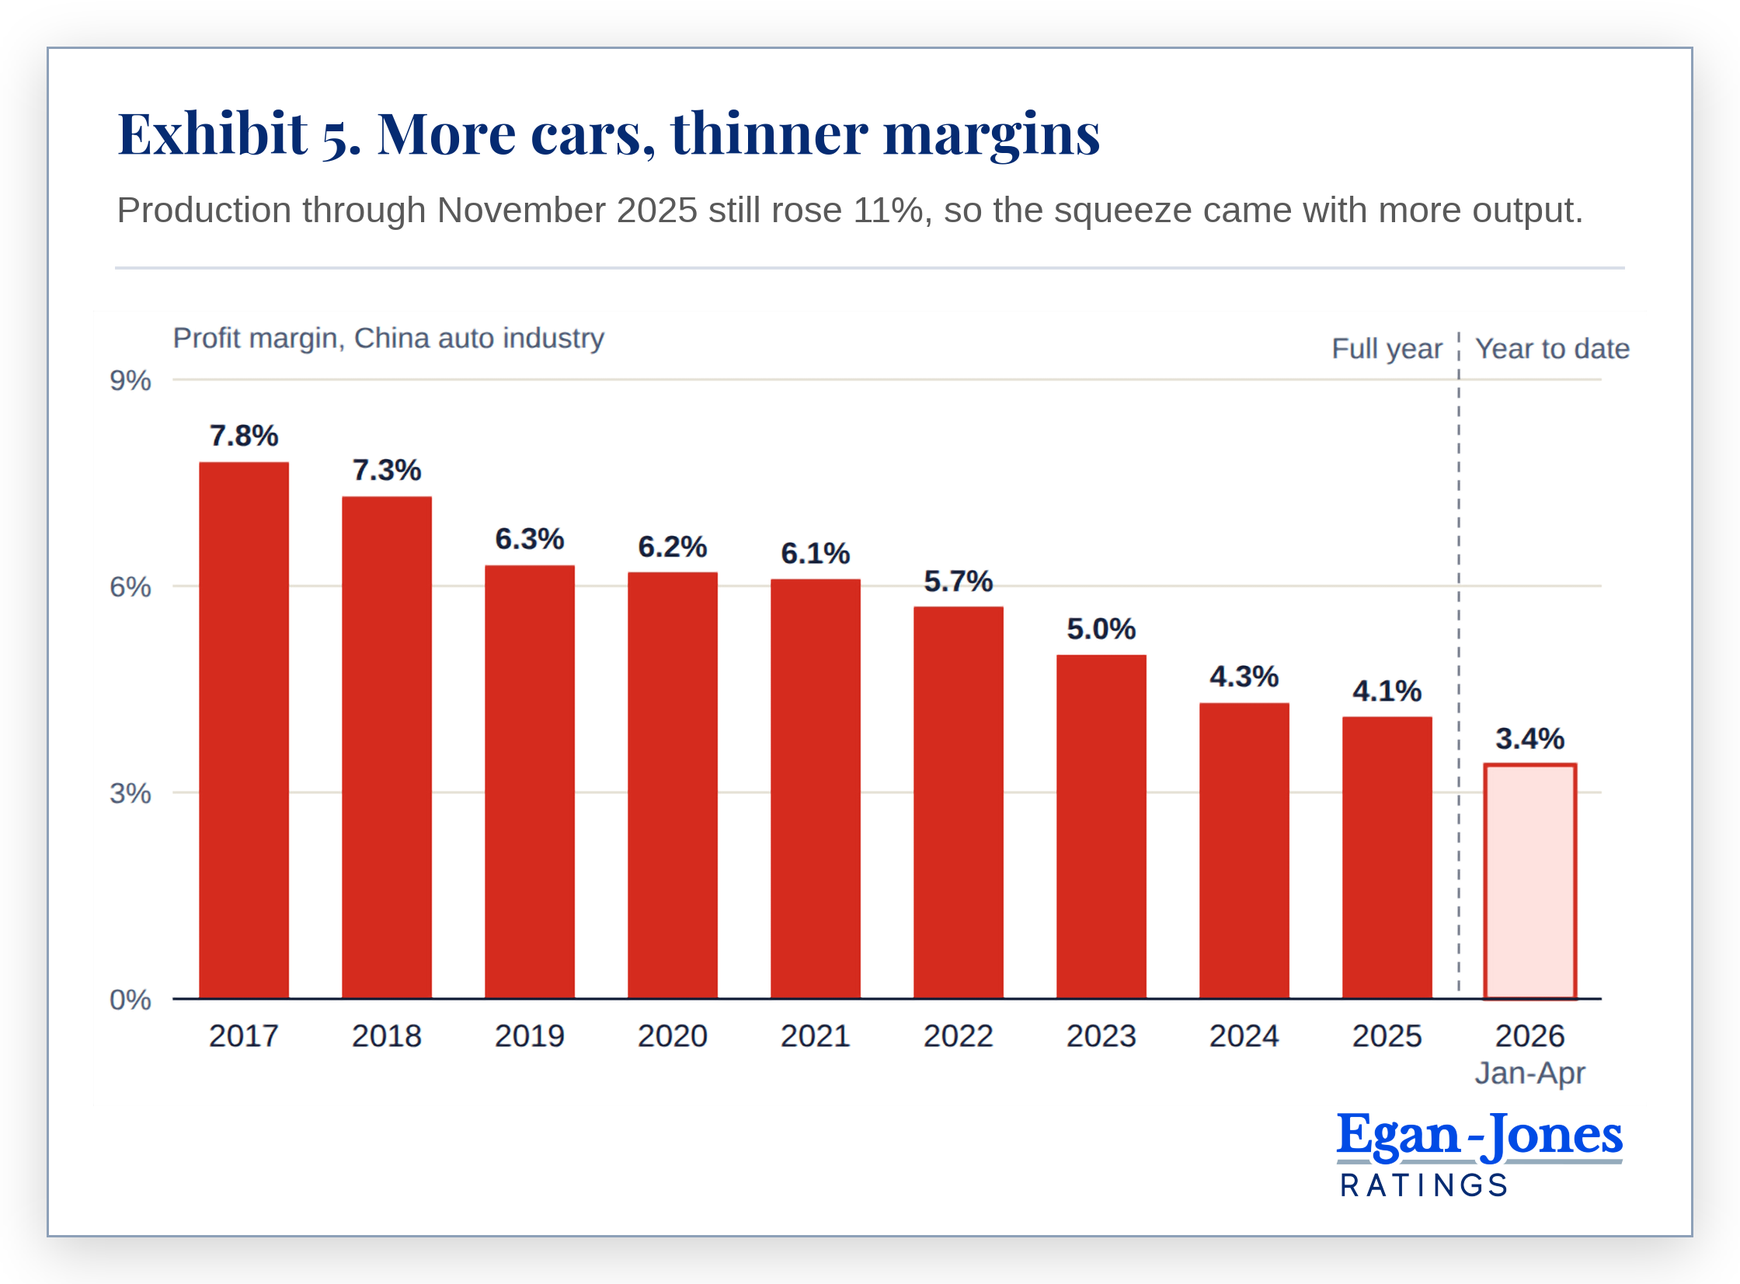
Cars are the clearest case: more cars, more brands, thinner margins.
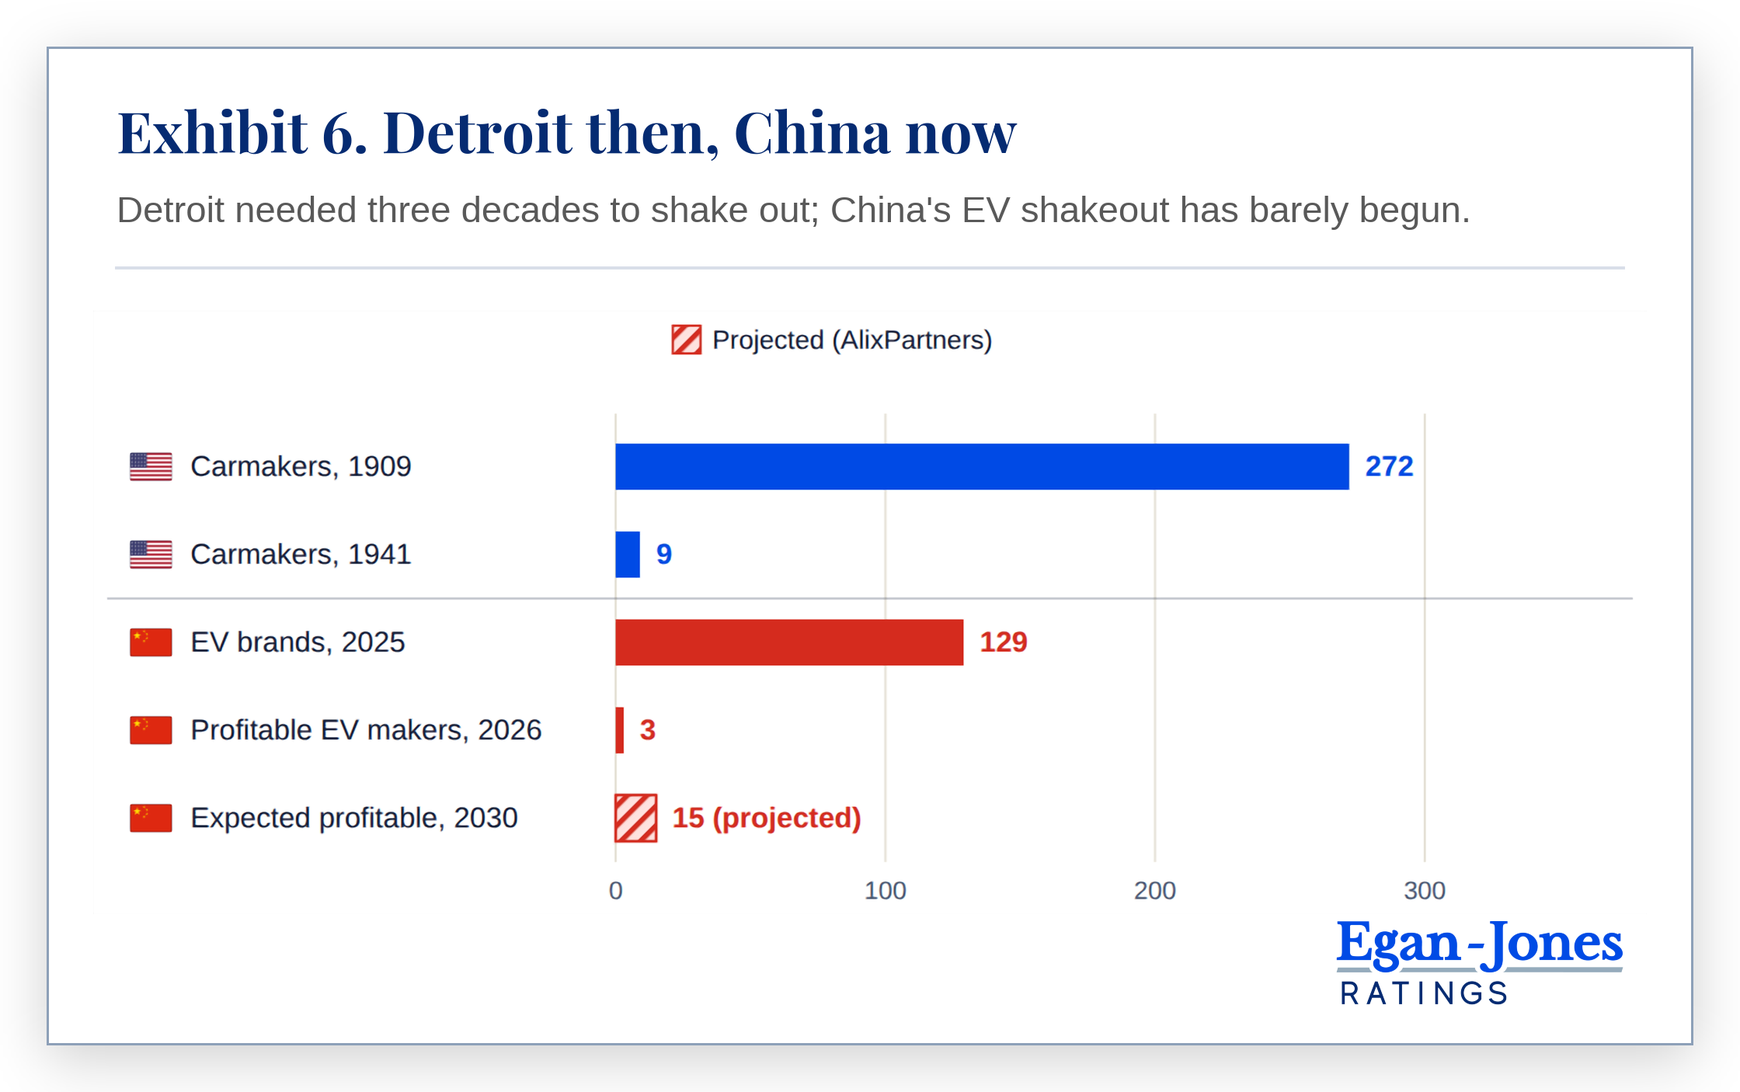
Few winners - BYD, Xiaomi and Leapmotor are the only EV makers in China making money today.10
Falling sales - battery-electric and plug-in hybrid sales fell 13% in the first half of 2026, the year Beijing halved the EV purchase tax exemption.10,11
Thinner margins - the industry's profit margin has fallen every year since 2017 and had nearly halved by 2025 (Exhibit 5).9,12
Source: China Passenger Car Association via CarNewsChina, Caixin and Gasgoo. The 2026 bar covers January to April only.
American equivalent
Steven Klepper of Carnegie Mellon traced the American version: the number of US carmakers peaked in 1909 and fell for three decades, and after 1930 GM, Ford and Chrysler made more than 80% of the output (Exhibit 6).13 China's EV industry looks similar to the American car industry around 1910.
Source: Klepper (2001); Rest of World, citing AlixPartners; Carscoops. US bars count producers; China bars count EV brands and makers.
V. Where the Growth Went
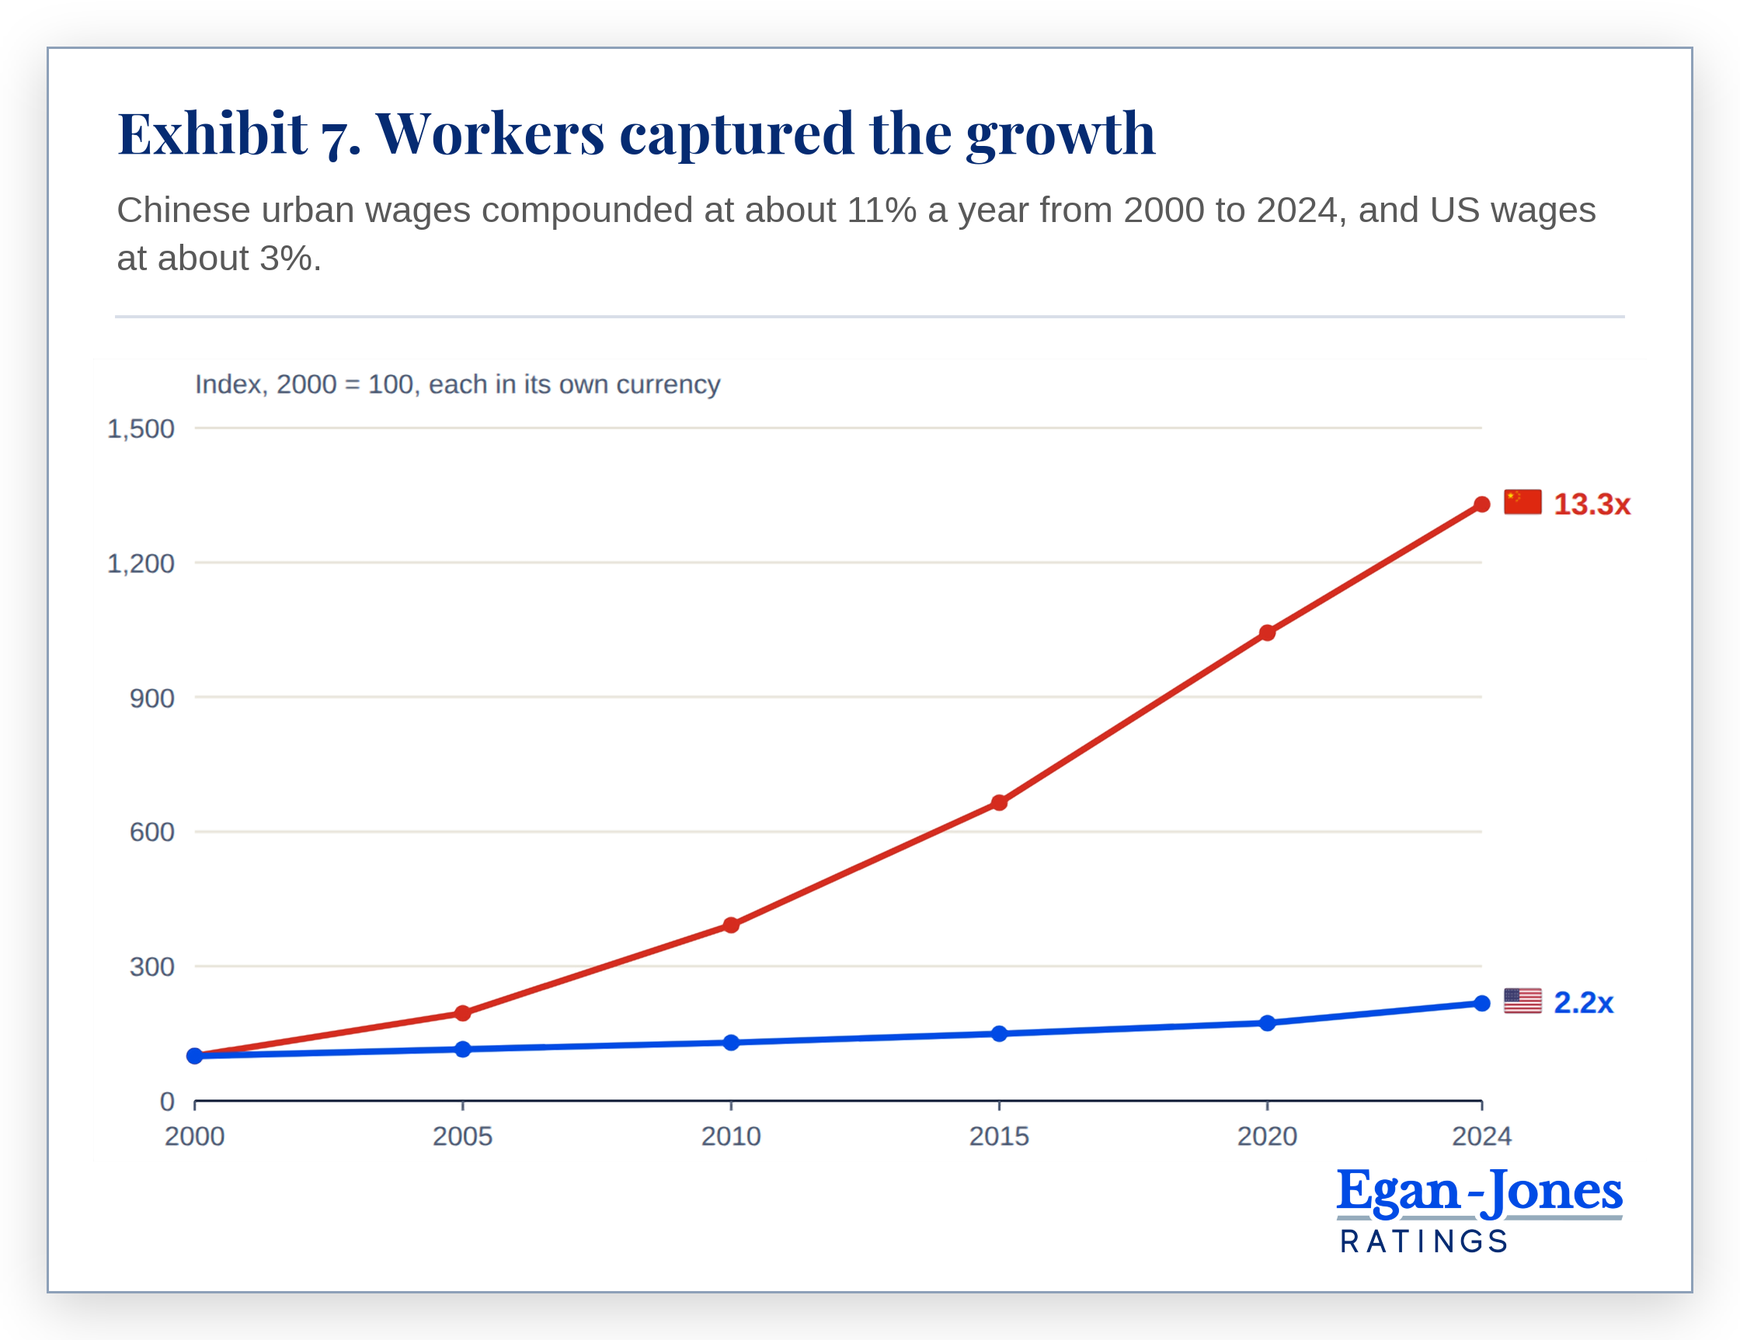
Workers and customers collected the gains that never reached shareholders.
Workers - Though well below American wages, Chinese urban wages multiplied many times over after 2000 and reached 129,441 yuan a year in 2025, while US wages roughly doubled (Exhibit 7).14,15
Customers - price wars passed much of the rest to buyers, as the car industry shows.
Shareholders - last in line. In a crowded industry, little is left by the time their turn comes.
Source: National Bureau of Statistics of China (average wage, urban non-private units); US Social Security Administration (National Average Wage Index).
VI. Can It Happen Here?
AI could bring China's squeeze to America: real growth, more competition, thinner returns.
AI may be able to increase American competition, thus reducing equity returns. A few points:
The price of intelligence is collapsing - a given level of AI model performance gets about 10x cheaper each year, by Andreessen Horowitz's estimate, and Epoch AI finds declines of 9x to 900x a year depending on the task.16,17
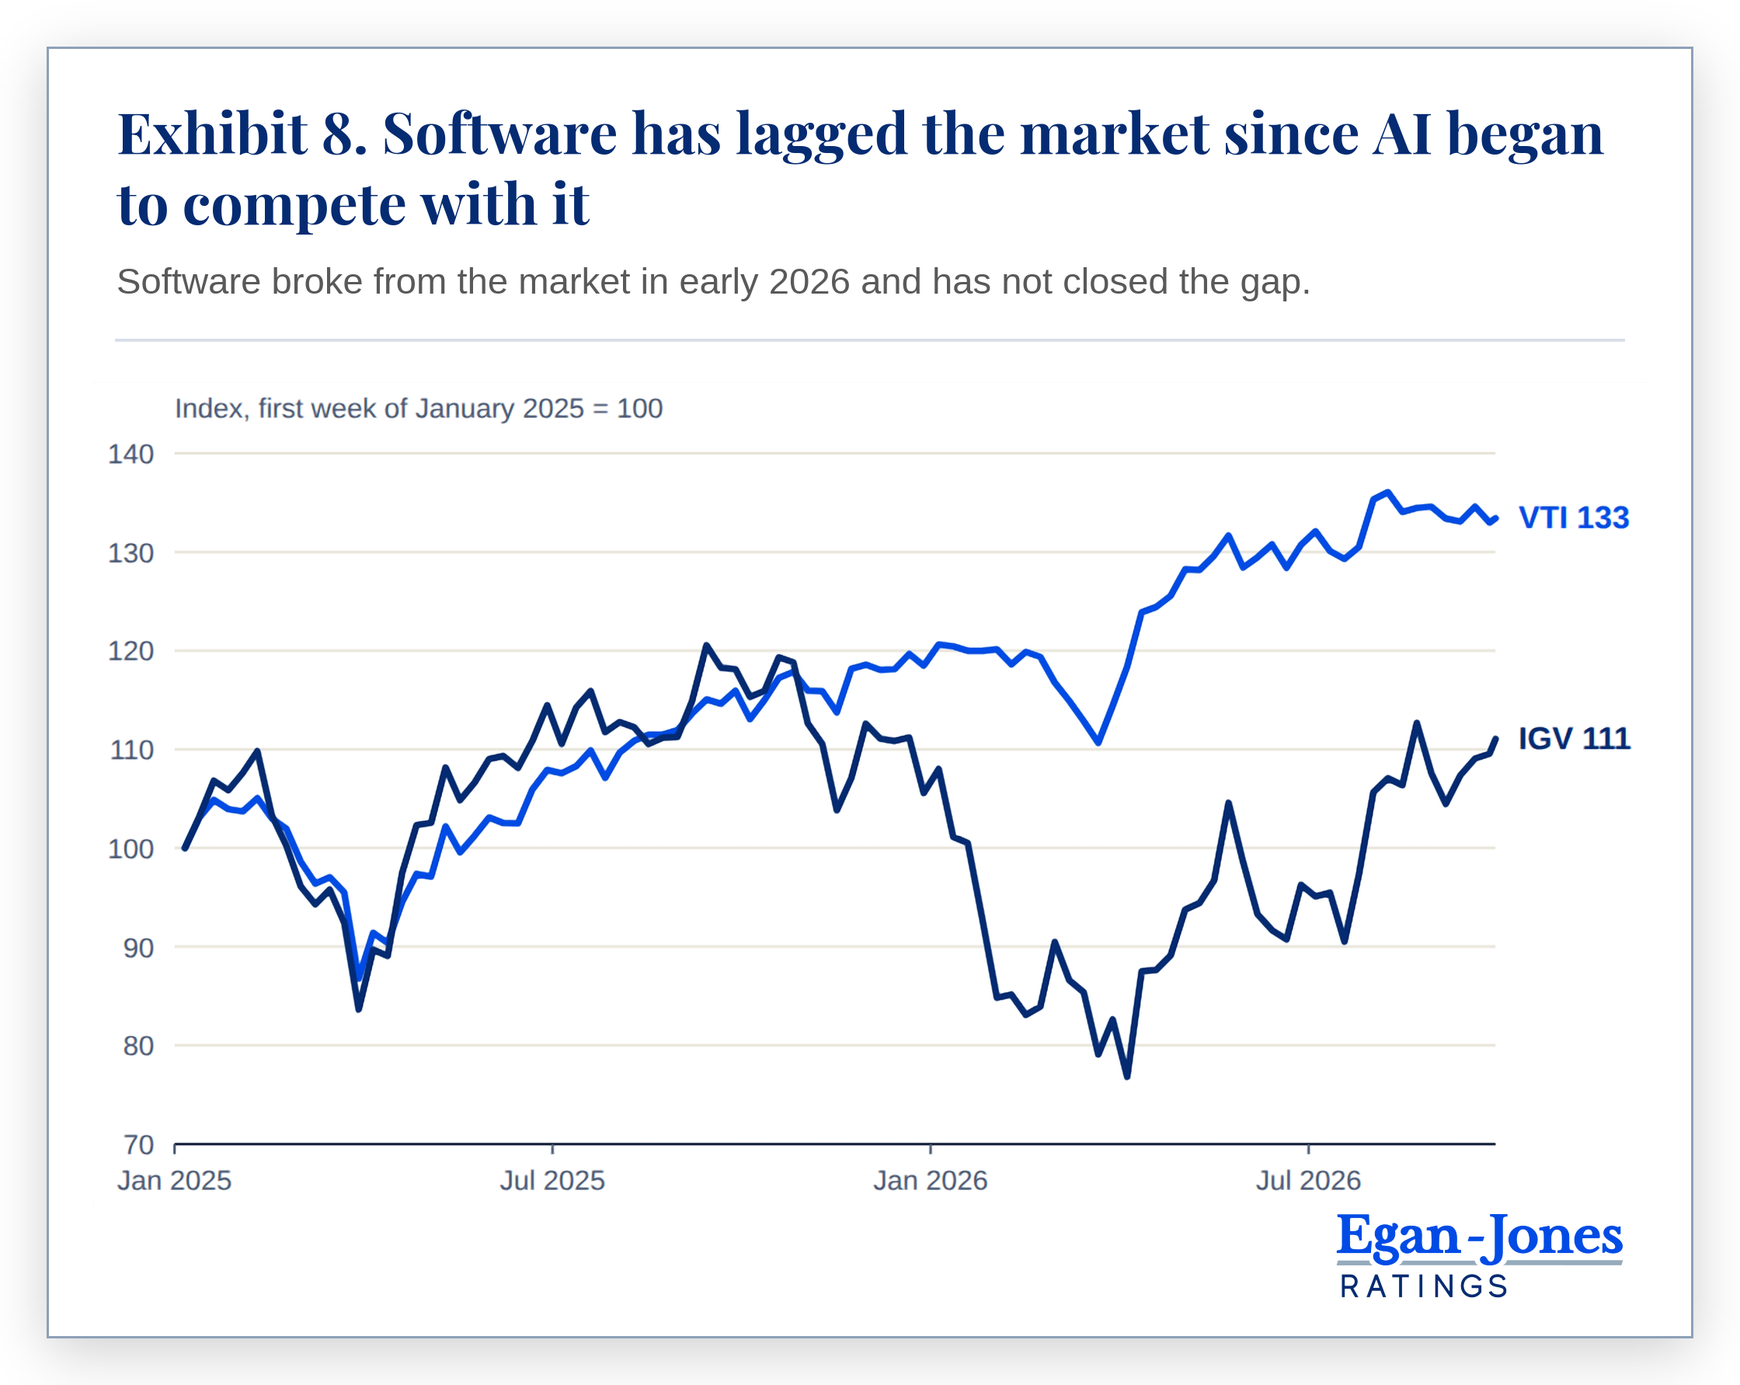
Entry is getting cheaper - software stocks sold off in early 2026 after new AI automation tools raised doubts about vendors' pricing power (Exhibit 8).
The leaders spend like heavy industry - Amazon, Alphabet, Meta and Microsoft have raised their 2026 capital spending plans about 14% since January, and Alphabet reported negative free cash flow in the second quarter.18
Source: Yahoo Finance, weekly adjusted closes for IGV and VTI.
If AI turns more US industries into contests among many capable rivals, customers will collect most of the benefit, and the premium on US equities will be harder to defend.
VII. Conclusion
China's equity market has suffered while its economy has succeeded. If one measures wealth by the ability to achieve ends, China has become massively wealthy. We will explore this more in future commentaries. The world is changing rapidly. This installment aims to provide a framework of possible major shifts for the benefit of sophisticated institutional investors and risk managers.
Sources & Footnotes
World Bank, GDP in current US dollars, in constant 2015 US dollars and at purchasing power parity (current international dollars), China and United States, 2004-2025. GDP (current US$); GDP, PPP.
Yahoo Finance, monthly adjusted closes (dividends reinvested) for FXI, MCHI and VTI, through September 2026. FXI; VTI.
Jay R. Ritter, "Economic Growth and Equity Returns," Pacific-Basin Finance Journal (2005).
WorldPERatio, trailing P/E ratios calculated on the FXI and VTI ETFs, October 1, 2026. China; United States.
South China Morning Post, "Chinese AI stocks to drive market gains in 2026, though pace set to cool, banks say."
Bloomberg, "Chinese Stocks in Hong Kong Extend Slump to Enter Bear Market," June 23, 2026.
Business Recorder (Reuters), "China, Hong Kong stocks slip as investors weigh Trump-Xi summit outcome," September 2026.
Aswath Damodaran, NYU Stern, return on capital and cost of capital by industry, US and China datasets, updated January 5, 2026.
Gasgoo, "Auto Industry Profit Margins Sink to New Lows: Who Is Pocketing the Profits?" citing the China Passenger Car Association.
Carscoops, "China's Electrified Car Sales Sank 13%, And The World Is About To Feel It," July 2026.
Rest of World, "The great Chinese EV exodus," citing AlixPartners, 2026.
CarNewsChina, "Profit margin of China's auto industry was 4.4%," citing the China Passenger Car Association, December 27, 2025.
Steven Klepper, "The Evolution of the U.S. Automobile Industry and Detroit as Its Capital," Carnegie Mellon University, 2001.
National Bureau of Statistics of China, average annual wage in urban non-private units: China Statistical Yearbook 2011, Table 4-13 (2000-2010); NBS series A040I01 via DBnomics (2015-2023); NBS release for 2025 (2024-2025). Yearbook 2011; DBnomics; 2025 release.
Andreessen Horowitz, "Welcome to LLMflation: LLM inference cost is going down fast."
Epoch AI, "LLM inference prices have fallen rapidly but unequally across tasks."
Platformonomics, "Follow the CAPEX: Q2 2026 Scoreboard," July 2026, compiling company guidance and earnings-call remarks.
Additional Sources
Wikipedia, "Suffering from Success" (DJ Khaled, 2013).
Caixin Global, "Chinese Automakers Report Shrinking Profits for 2025 Amid Brutal Price War," April 15, 2026.
Caixin Global, "Meituan Warns of Loss as High as $3.5 Billion Amid Subsidy War," February 14, 2026, and "Meituan Swings to $3 Billion Loss as Delivery Price War Bites," March 27, 2026. February 14; March 27.
Axios, "The AI disruption in software is here," February 3, 2026.
Exhibit 1 - World Bank; Yahoo Finance (FXI, VTI); WorldPERatio; Aswath Damodaran, NYU Stern (January 2026); National Bureau of Statistics of China; US Social Security Administration.
Exhibit 2 - World Bank (GDP in current US$ and at PPP); Yahoo Finance (FXI and VTI adjusted closes, December 2004 to December 2025).
Exhibit 3 - WorldPERatio.com, monthly trailing P/E of the FXI and VTI ETFs, January 2005 to October 2026.
Exhibit 4 - Aswath Damodaran, NYU Stern, January 2026.
Exhibit 5 - China Passenger Car Association via CarNewsChina, Caixin and Gasgoo.
Exhibit 6 - Klepper (2001); Rest of World, citing AlixPartners; Carscoops. US bars count producers; China bars count EV brands and makers.
Exhibit 7 - National Bureau of Statistics of China; US Social Security Administration.
Exhibit 8 - Yahoo Finance, weekly adjusted closes for IGV and VTI.
Egan-Jones Insight
Receive the latest insights on the proxy market.
Thank you! Your submission has been received!
Oops! Something went wrong while submitting the form.