.svg)

In an attempt to assist sophisticated risk and portfolio managers of structured finance assets, we delve into the critical area of statistics. A core issue in nearly every transaction is whether the pool is properly constructed, properly assessed, and properly managed. For this task, statistics are front and center.
Our premise is that the subprime crisis was really the result of not using statistics, rather than misusing them. Through the crisis, little work was done on whether the assets in the pool were sound and whether they were representative of the performance of the overall pool. Stress-testing (as opposed to full Monte Carlo simulation) is helpful if the underlying assumptions on the quality of the assets are sound.
Below are some fundamental principles in the usage of statistics.
The first fundamental principle of statistical analysis is that statistics measure correlation, not causality, which means that no amount of positive or negative correlation will prove that two or more variables are causally related, and vice versa. For example, it can be shown that during some periods, the correlation between sunspot frequency and Republicans in the Senate was near 95%. In other words, much can be made of statistical analysis that has nothing to do with the truth. The danger comes from assuming one factor drives another when there is little support for that assumption. For example, if the rainfall in one area is low and the defaults on mortgages in that area are also low, it is normally silly to tie the two events.
Some will claim “there are lies, damn lies and statistics”, but that is not quite true. In reality, statistics don’t lie, but statisticians do. Speaking of lies, please consider the following statements:
Needless to say, investors should remain on the lookout for these misstatements.
The second fundamental principle is that all statistical analyses must be disclosed, and their conclusions partitioned, a priori (i.e., at the start). What does this mean? It means that you must disclose the rules of engagement before the game starts. A serious statistician will always tell you before starting how the analysis will be conducted, how the inference will be carried out, and likely results. If not, there is a likelihood that there is little understanding of the underlying data.
Micro-economic analysis, the first and most critical level in which statistics are asked to play a part, must be supplemented with macro-economic analysis. This convolution is where the meaningless dream world of raw datasets comes face to face with the real world of risk management. The data might be ideal, but if not supplemented by basic questions regarding reliability and reasonableness, much is lost. Splitting the analysis into those twin components enhances one’s understanding of the transaction dynamics.
Another area needing attention is the confusion between standard deviation and standard error. The term “standard deviation” applies strictly to local statistics. For example, when talking about a portfolio of 50 identical and nominally independent loan-assets, if someone tells you that the expected loss of each loan is 5% with a standard deviation of 15% of the loss, it means that the sampling distribution of this portfolio will have an expected loss of 5% too but a smaller “standard deviation”. In this case, because of the typical normal distribution, the portfolio’s standard deviation would be around:
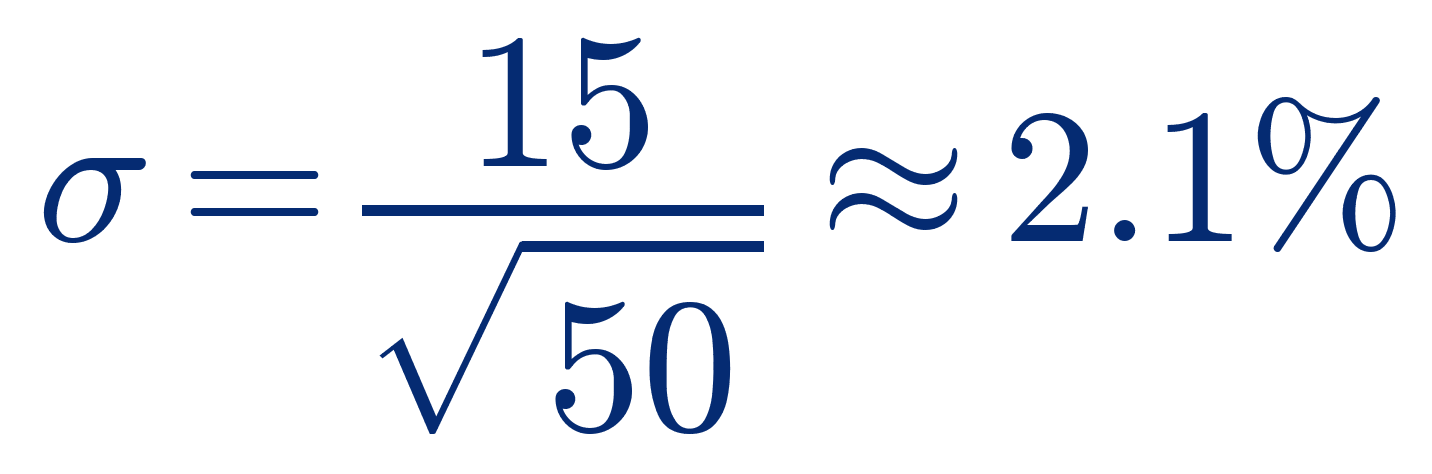
which is a very different number.

It is to avoid this fundamental confusion that we encourage using the expression “standard error”, instead of “standard deviation”, when publicly discussing portfolio statistics.
The proper use of statistics offers significant protection for sophisticated risk managers and institutional investors in structured finance assets. When properly used by people without pretense to perfect knowledge, there is nothing wrong with sophisticated cash flow modeling combined with grounded statistical inference. Finance is not physics.
Diversification: One Loan vs Fifty: Egan-Jones illustrative example. A single loan is modeled as either no loss (about 90% of the time) or default with roughly a 50% loss (about 10% of the time), giving a 5% expected loss and a 15% standard deviation; averaging 50 such loans gives an approximately normal pool loss centered at 5% with standard error σ = 15 / √50 ≈ 2.1%.


.jpg)