Keeping the Party Line on AI
October 9, 2026

Overview
The four largest hyperscalers plan over $700 billion of capital spending this year;¹ the pro-AI super PAC network Leading the Future has raised $140 million for the midterms.²
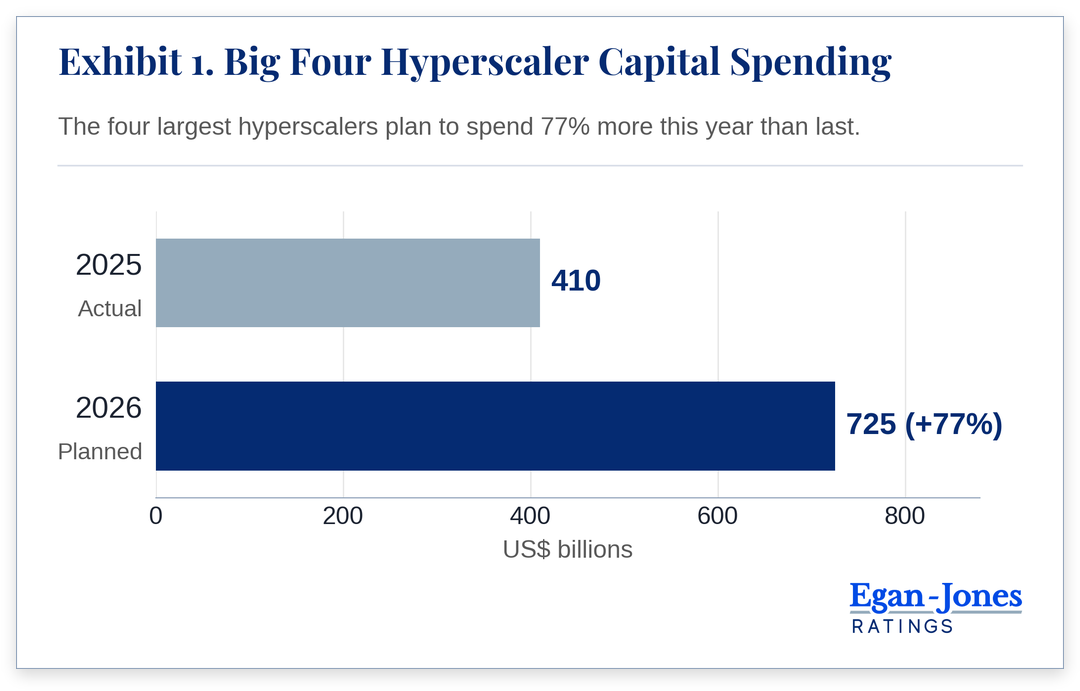 Alphabet, Amazon, Meta and Microsoft. Source: Yahoo Finance, June 3, 2026.
Our premise is that the mainstreams of both parties will keep backing AI in effect if not in rhetoric, as they have backed drug makers through years of public anger over prices. The populist wings will be the primary push to halt the buildout or spread the wealth. This installment offers sophisticated institutional investors and risk managers a framework for the political risk associated with the unprecedented AI buildout.
I. The Pharma Playbook
Gallup finds 71% of Americans oppose a local AI data center, versus 53% for a nuclear plant.³
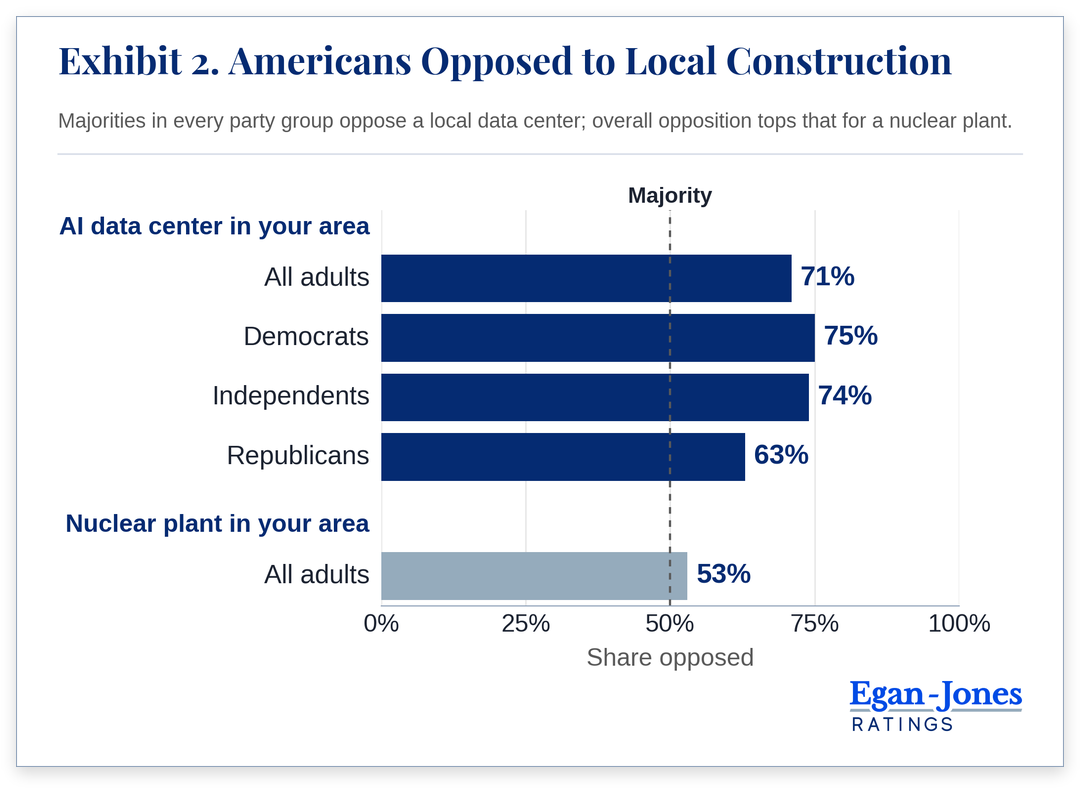 Source: Gallup, survey of 1,000 adults, March 2-18, 2026.
Similarly, drug makers have remained unpopular for years,⁴ yet pharma has outspent every other industry on federal lobbying in all but one quarter since 2010,⁵ and both parties keep backing it. Public anger over prices was concentrated toward profit-seeking fall men such as Martin Shkreli, though no new laws have been sufficient to halt growth in the lucrative industry.
Credit cards and sports betting show the same pattern. A 10% cap on card interest rates, backed at different times by President Trump, Bernie Sanders and Josh Hawley, has sat in committee since February 2025.⁶ Sports betting is now legal in much of the country, though 43% of Americans call that bad for society and 7% call it good,⁷ and betting companies had put $45.6 million into this year’s midterms by the end of the first quarter.⁸
We expect AI to follow the same path, perhaps further. Big Tech and AI spend about a sixth of pharma’s lobbying total⁹ but have made up ground at the ballot box: Leading the Future spent some $8 million against Alex Bores, author of New York’s AI safety law, who narrowly lost his June primary.²
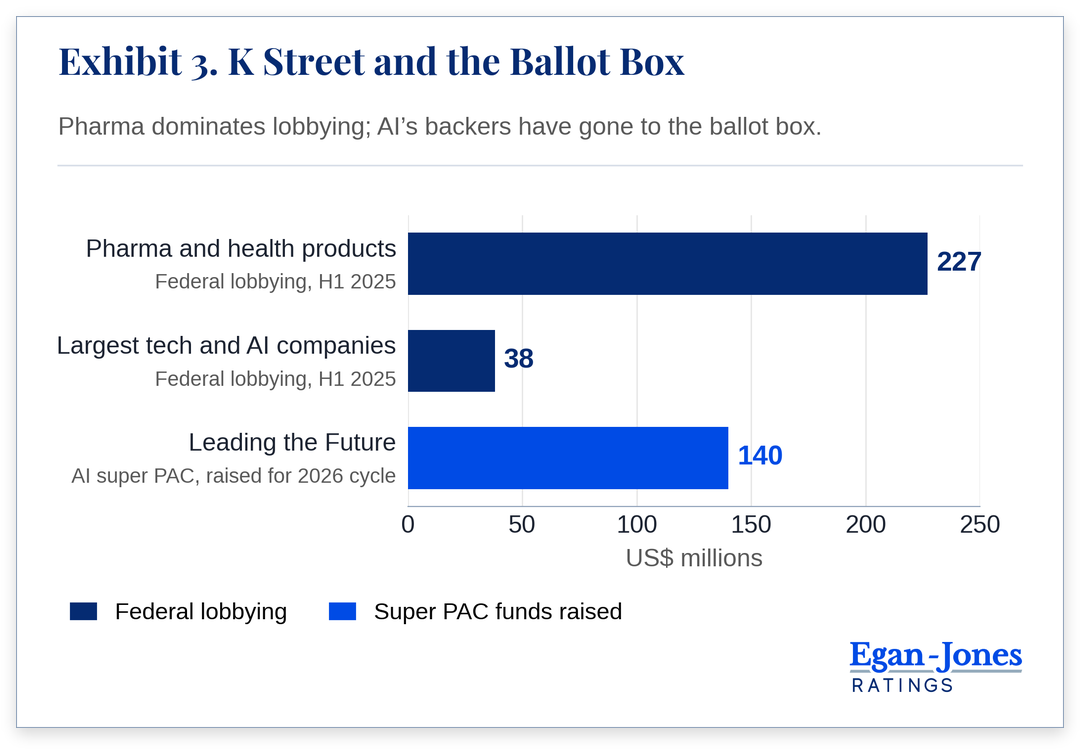 Sources: OpenSecrets analysis via The Fulcrum; Issue One (the 11 largest tech, social media and AI companies plus their trade groups); Pluribus News via Arizona Capitol Times. Lobbying and super PAC figures measure different activities over different periods.
II. 417 to 3
The House vote on September 16 shows how that works. By 417 to 3, members passed a bill pushing states to make large data centers pay for the power lines and plants built to serve them.¹⁰ It answers one of the public’s main complaints, higher power bills, and puts no limit on how many data centers get built. All three no votes came from progressives, and one of them, Rashida Tlaib, called for a national moratorium.
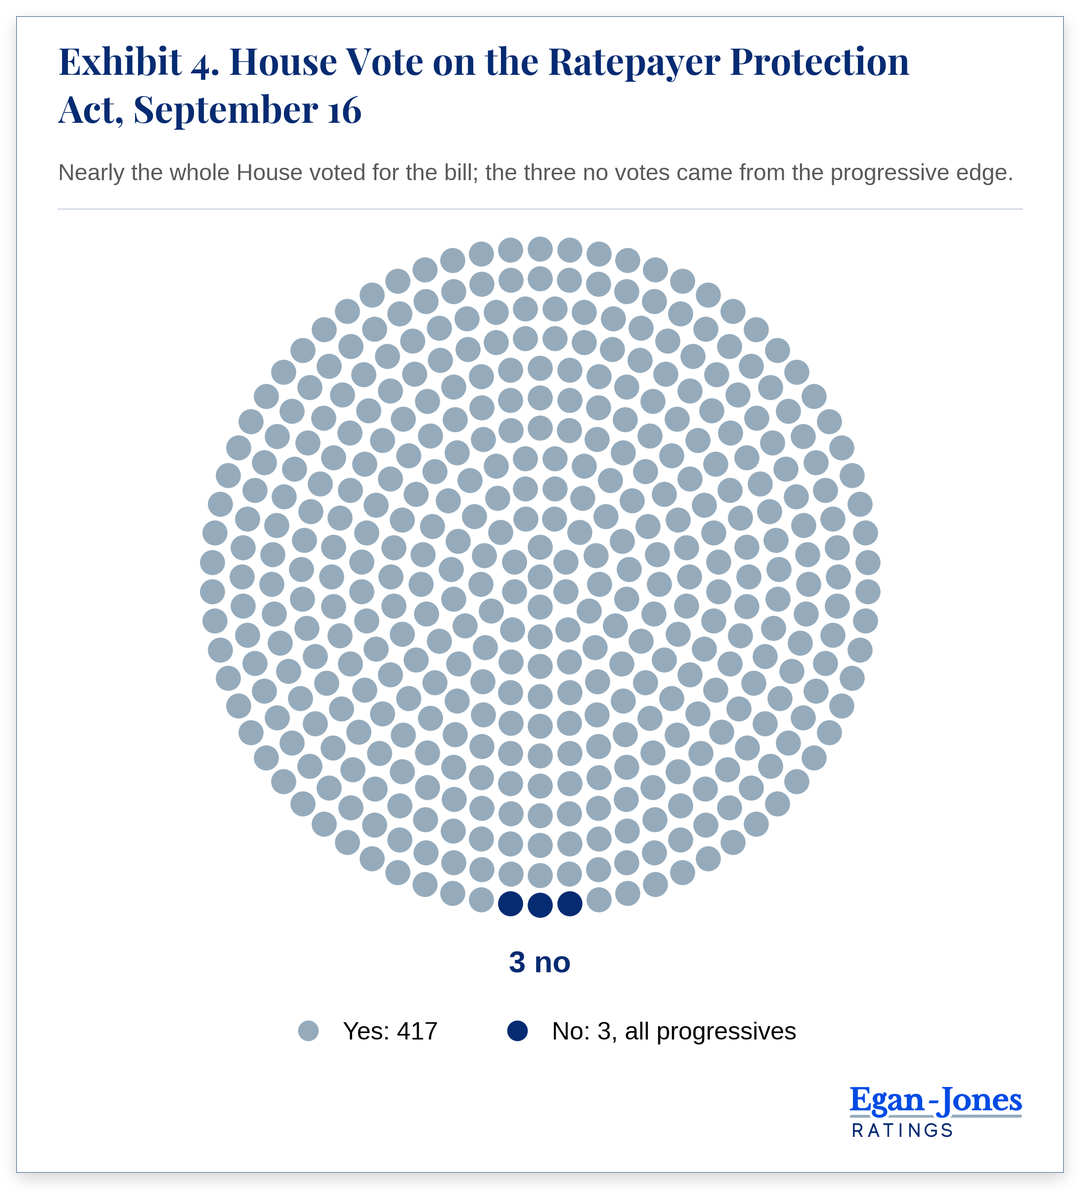 One dot per vote cast. Source: NBC News, September 16, 2026.
That is the mainstream approach by both parties: act to show the public that some action was taken, though do not halt growth.
III. The States Push Back
Governors face pushback for infrastructure projects more directly, and several have turned on the industry. Greg Abbott, who once billed Texas as the “epicenter” of AI, has frozen new data center grid approvals and permits ahead of his reelection bid.¹¹ Gavin Newsom, who vetoed a water disclosure bill last year, signed a seven-bill package on September 21 that shifts grid costs onto operators.¹² Ron DeSantis, a Republican wary of AI, signed a law in May so that Floridians would not pay “one more red cent” for data centers’ power;¹³ talks with the White House softened the final bill.¹⁴
China has been supportive of forestalling U.S. AI development. In June OpenAI shut down ChatGPT accounts likely run by a private Chinese technology firm working for Chinese provincial government clients; they produced posts and cartoons blaming data centers for higher power bills.¹⁵ In August X disclosed about 200 accounts from a suspected Chinese bot farm pushing the same message, accounts it had already suspended earlier in the year.¹⁶
IV. Incumbent Advantage
An important question is federal regulation on AI. No clear path forward is underway as the current White House seems opposed to federal regulation in order to avoid stymying AI growth. However, incumbents often seek regulatory capture: rules that end up serving the firms they regulate by dissuading newcomers.
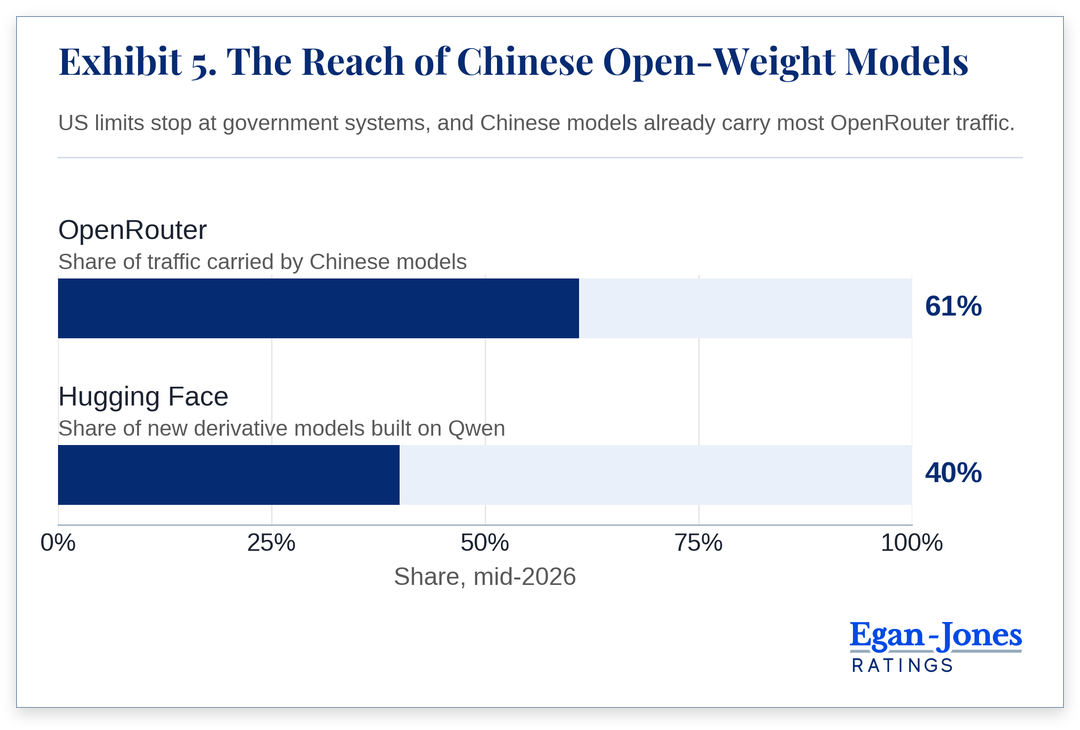 Source: Sheppard Mullin, July 23, 2026, citing OpenRouter and Hugging Face data.
V. Credit Impacts
The fight over who pays for power, and who waits for permits, lands on credit as follows.
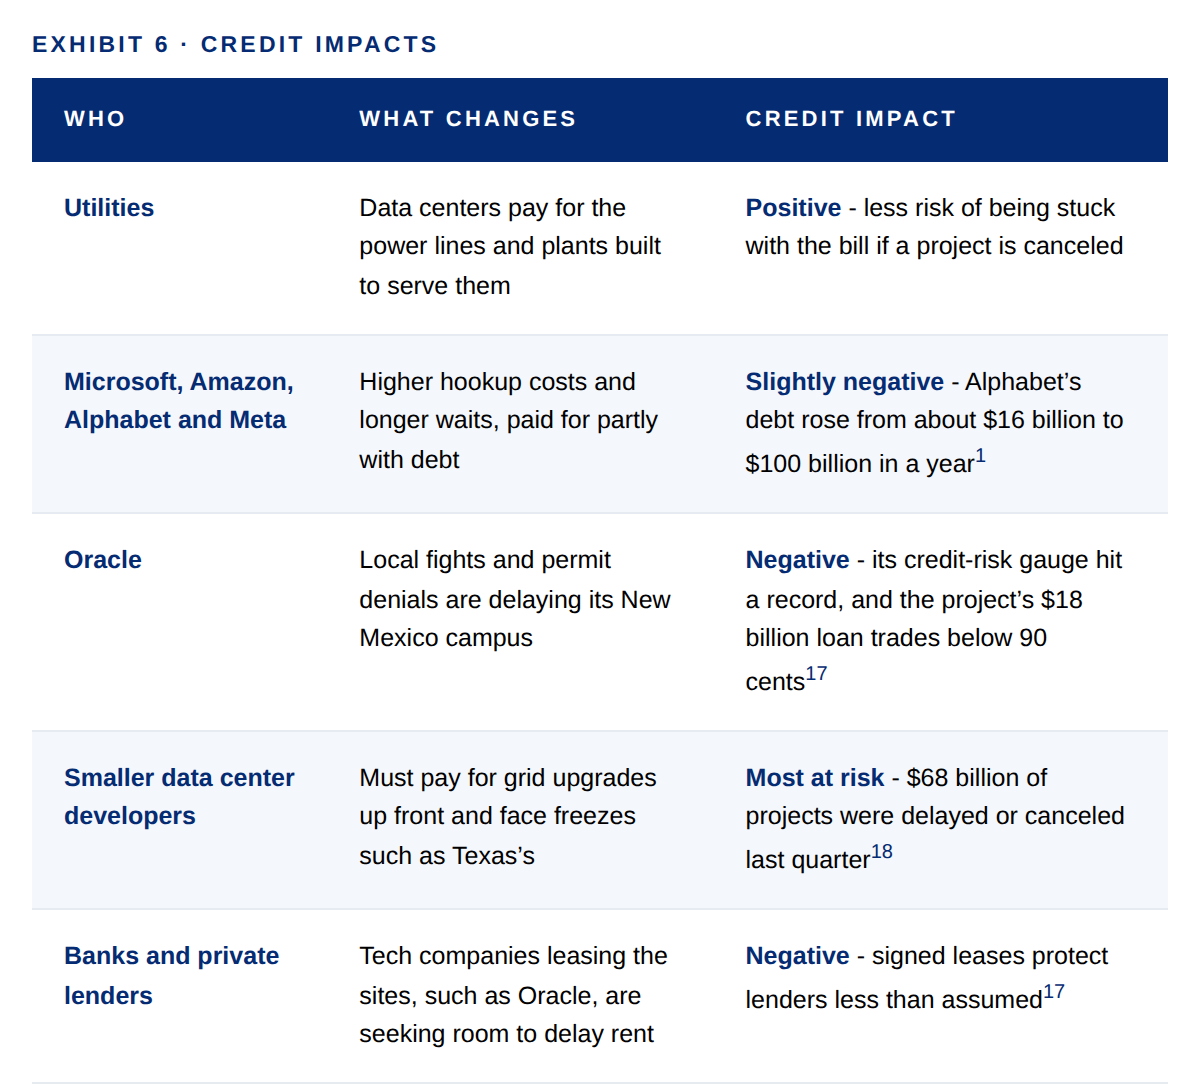 Egan-Jones assessment; sources in notes 1, 17 and 18.
VI. Conclusion
It is reasonable to expect higher costs and slower permits for the industry. The money keeps both parties’ mainstream on board with AI growth. This is perhaps the fastest industrial buildout in world history. Sophisticated institutional investors must pay attention.
Kingdom of Spain
Rating Analysis | 8/13/26
Egan-Jones Senior Rating (Current / Projected): BBB+ / BBB+. This is a non-NRSRO rating.
Spain has emerged as one of the eurozone's most resilient and consistently outperforming economies in the post-pandemic era. With real GDP growth of 3.5% in 2024 and a projected 2.9% in 2025 - significantly ahead of the eurozone average - the economy has demonstrated broad-based momentum anchored by robust domestic consumption, record-breaking tourism receipts and strong employment.
While Spain's headline trajectory is favourable, several structural vulnerabilities warrant careful monitoring. Productivity growth remains subdued relative to output growth, with much of the labour force expansion driven by immigration rather than efficiency gains - GDP per capita has outpaced the eurozone by only 1.4bps since 2019, despite the aggregate GDP growth differential being far wider. The economy is also exposed to global trade risks, given the sensitivity of its export-oriented SME sector and goods exporters. Nevertheless, the combination of a declining fiscal deficit, improving banking sector health, and strong investor demand for Spanish sovereign debt positions the country constructively. Affirming.
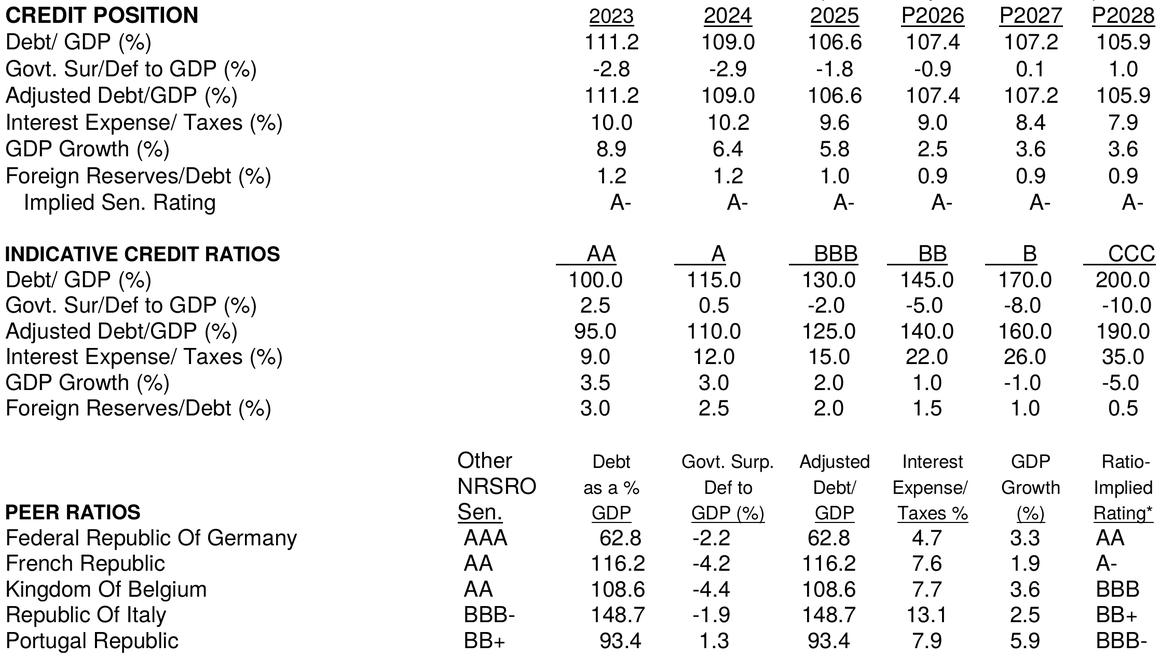 Annual ratios; source for past results: IMF. * Ratio-implied rating.
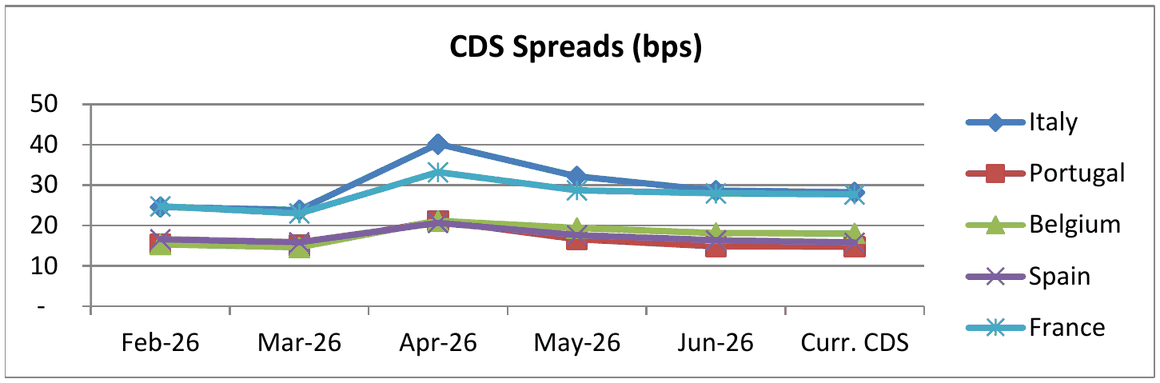
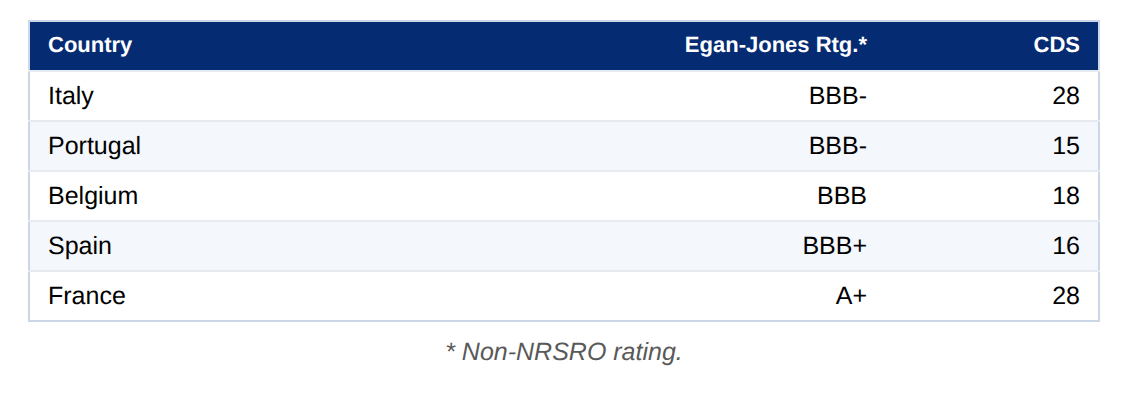 * Non-NRSRO rating.
Economic Growth
Spain's economic expansion has been one of the eurozone's standout narratives since 2022, sustained by a confluence of structural and cyclical drivers. GDP grew at 3.5% in 2024, materially surpassing European peers, underpinned by strong private consumption, buoyant service exports - particularly tourism - and continued gains in employment. In Q1 2026, GDP expanded by 0.6% quarter-on-quarter (2.7% year-on-year), continuing to outpace most European counterparts. Domestic demand remains the primary engine of growth, with consumption supported by solid real wage gains, demographic expansion through continued immigration, and improving household disposable income. Investment activity has been additionally bolstered by the accelerated drawdown of NGEU funds, with 2026 representing the final year of the programme. Despite the broadly positive momentum, the trajectory is one of gradual deceleration. The OECD's latest projections place growth at 2.9% for full-year 2025, moderating to around 2.2% in 2026 and further to 1.7-1.8% in 2027.
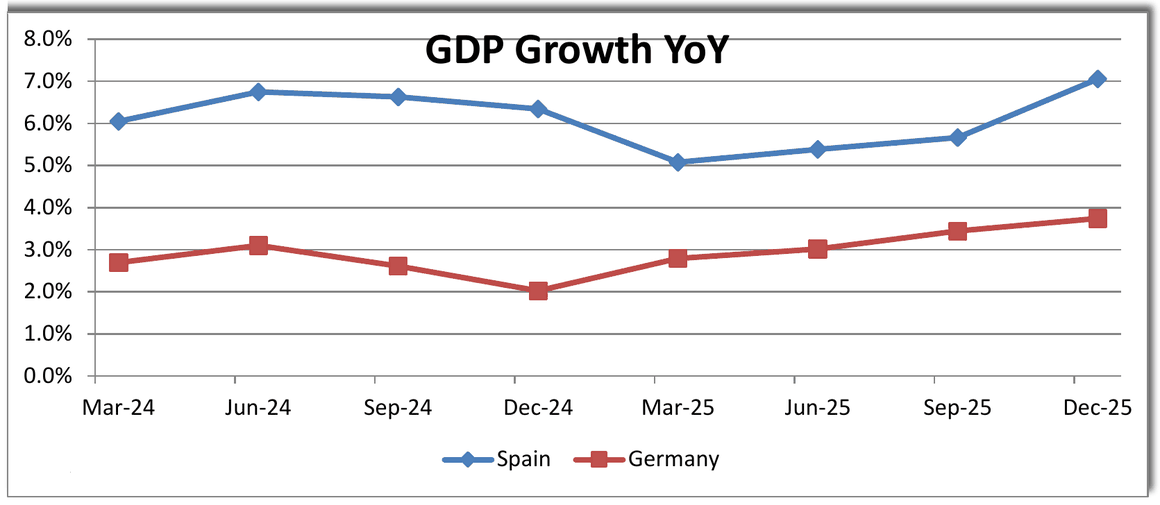 Source: IFS.
Fiscal Policy
Spain's fiscal position has improved meaningfully over recent years, supported by strong cyclical revenue performance and progressive expenditure consolidation. The public deficit is estimated to have declined to approximately 2.4% of GDP in 2025 - down from 3.2% in 2024 - driven by robust growth in income and social security revenues and selective restraint on the expenditure side, net of DANA-related disaster relief spending. Under current fiscal rules, the deficit is projected to narrow further to approximately 2.1% of GDP in 2026 and 1.7% in 2027.
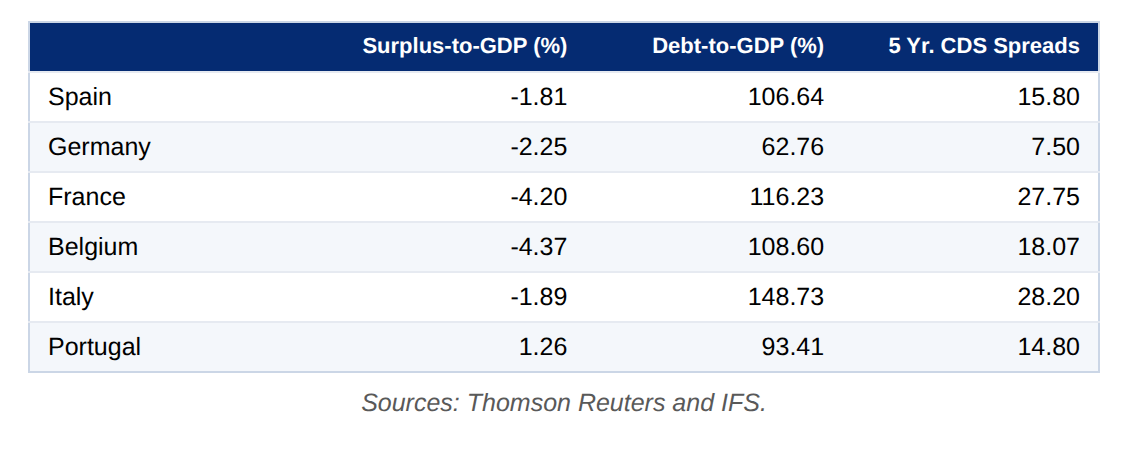 Sources: Thomson Reuters and IFS.
Unemployment
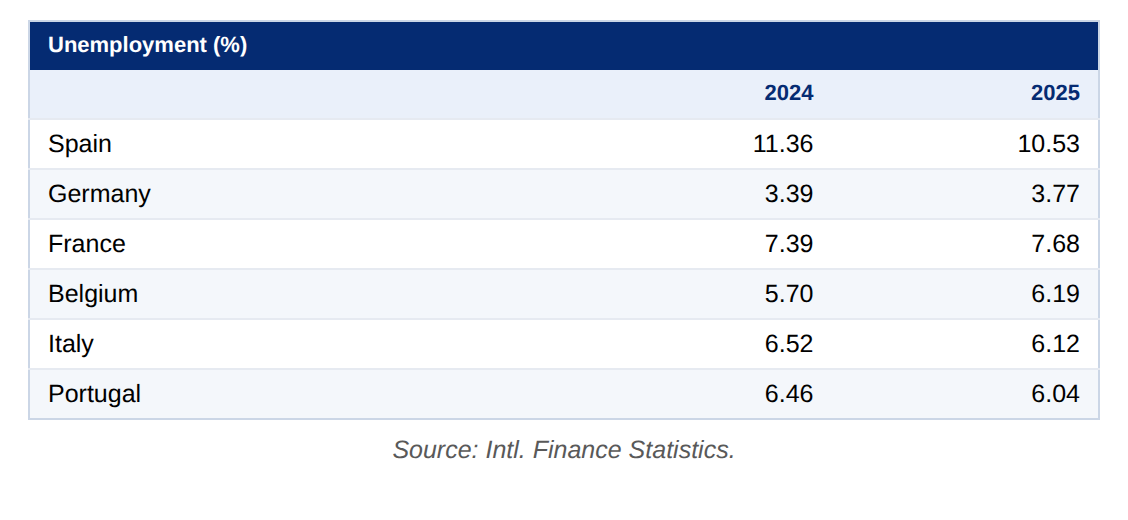
Spain's labour market has made substantial progress over recent years. Yet, unemployment remains the highest in the OECD - a structural characteristic that continues to distinguish the economy from its European peers. The unemployment rate reached 10.3% in March 2026 (Q1 2026: 10.83%), down from 11.8% in 2024 and continuing a multi-year downward trajectory. Job creation has been broad-based, spanning both the services and industrial sectors.
 Source: Intl. Finance Statistics.
Banking Sector
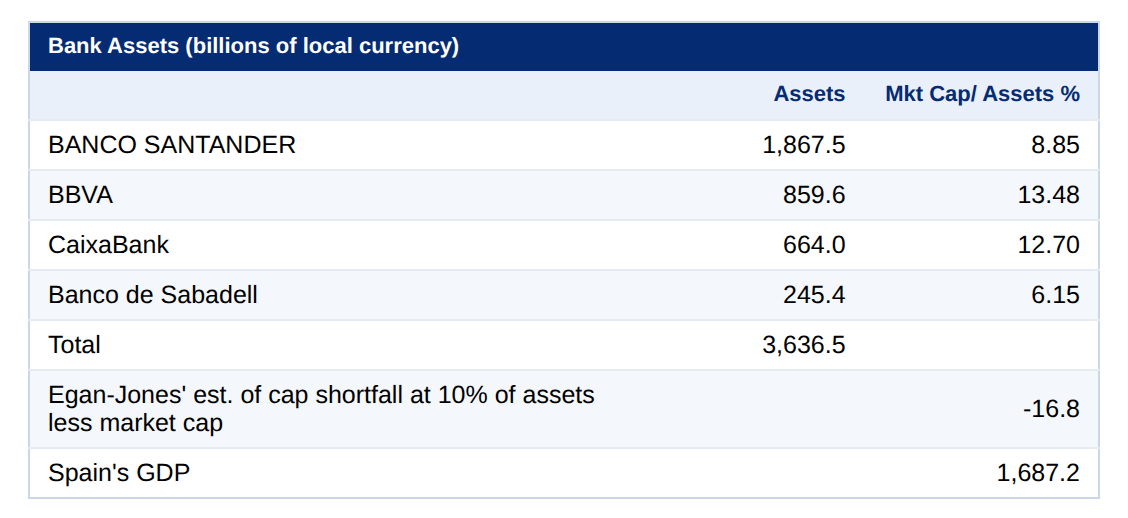
Spain's banking sector enters 2026 in a position of relative strength, having navigated the interest rate cycle with broadly preserved asset quality and improving profitability metrics. Non-performing loan (NPL) ratios have declined substantially from the crisis-era peak, reaching approximately 3.4% across the sector in mid-2024 - down from 4.8% in 2019 and a fraction of the distress levels seen in the early 2010s.
Funding Costs
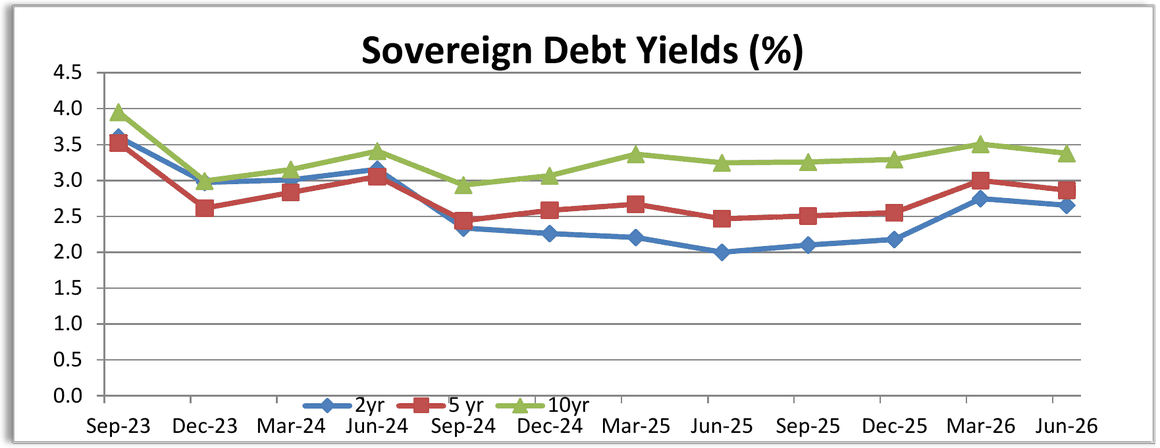
Financing conditions for Spanish corporates have eased materially from the peaks of the 2022-2023 monetary tightening cycle, though the environment has grown somewhat more complex in 2026. The ECB maintained its key policy rates unchanged at its March 2026 meeting - with the main refinancing operation rate at 2.15% - following the last rate cut in June 2025.
 Source: Thomson Reuters.
Ease of Doing Business
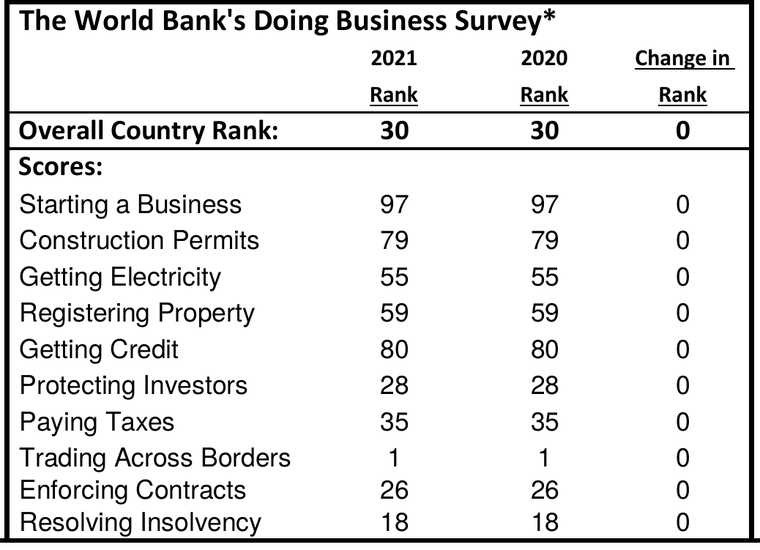
Major factors for growing the economy are the ease of doing business and the economic freedom; although not the sole factor for determining economic growth, a country which makes it easy for businesses to operate and provides a reasonably free environment to conduct business has a good chance for growth. The table below indicates that with an overall rank of 30 (1 is best, 189 worst) is strong.
 * Based on a scale of 1 to 189 with 1 being the highest ranking.
Economic Freedom
As can be seen below, Spain is above average in its overall rank of 66.8 for Economic Freedom with 100 being best.
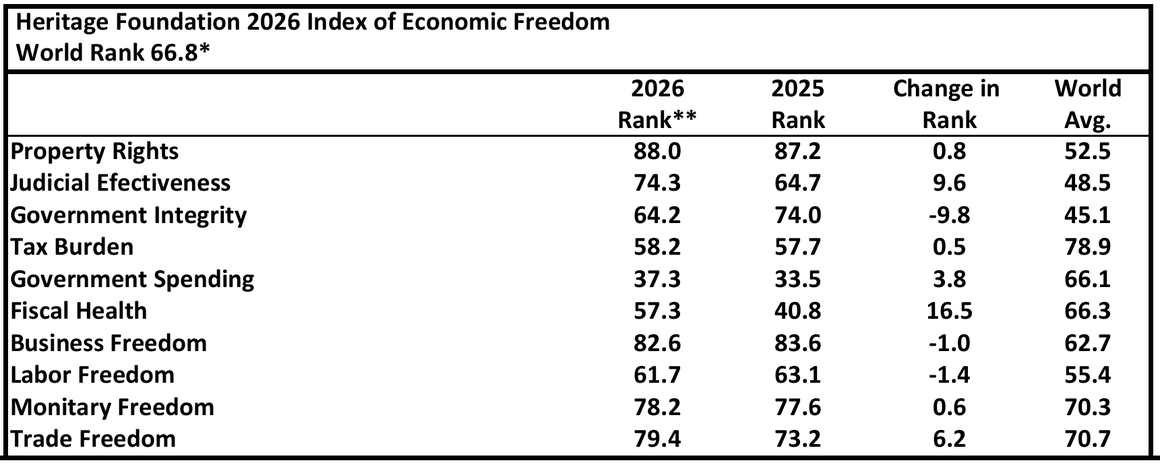 * Based on a scale of 1-100 with 100 being the highest ranking. ** The ten economic freedoms are based on a scale of 0 (least free) to 100 (most free). Source: The Heritage Foundation.
Credit Quality Driver: Taxes Growth
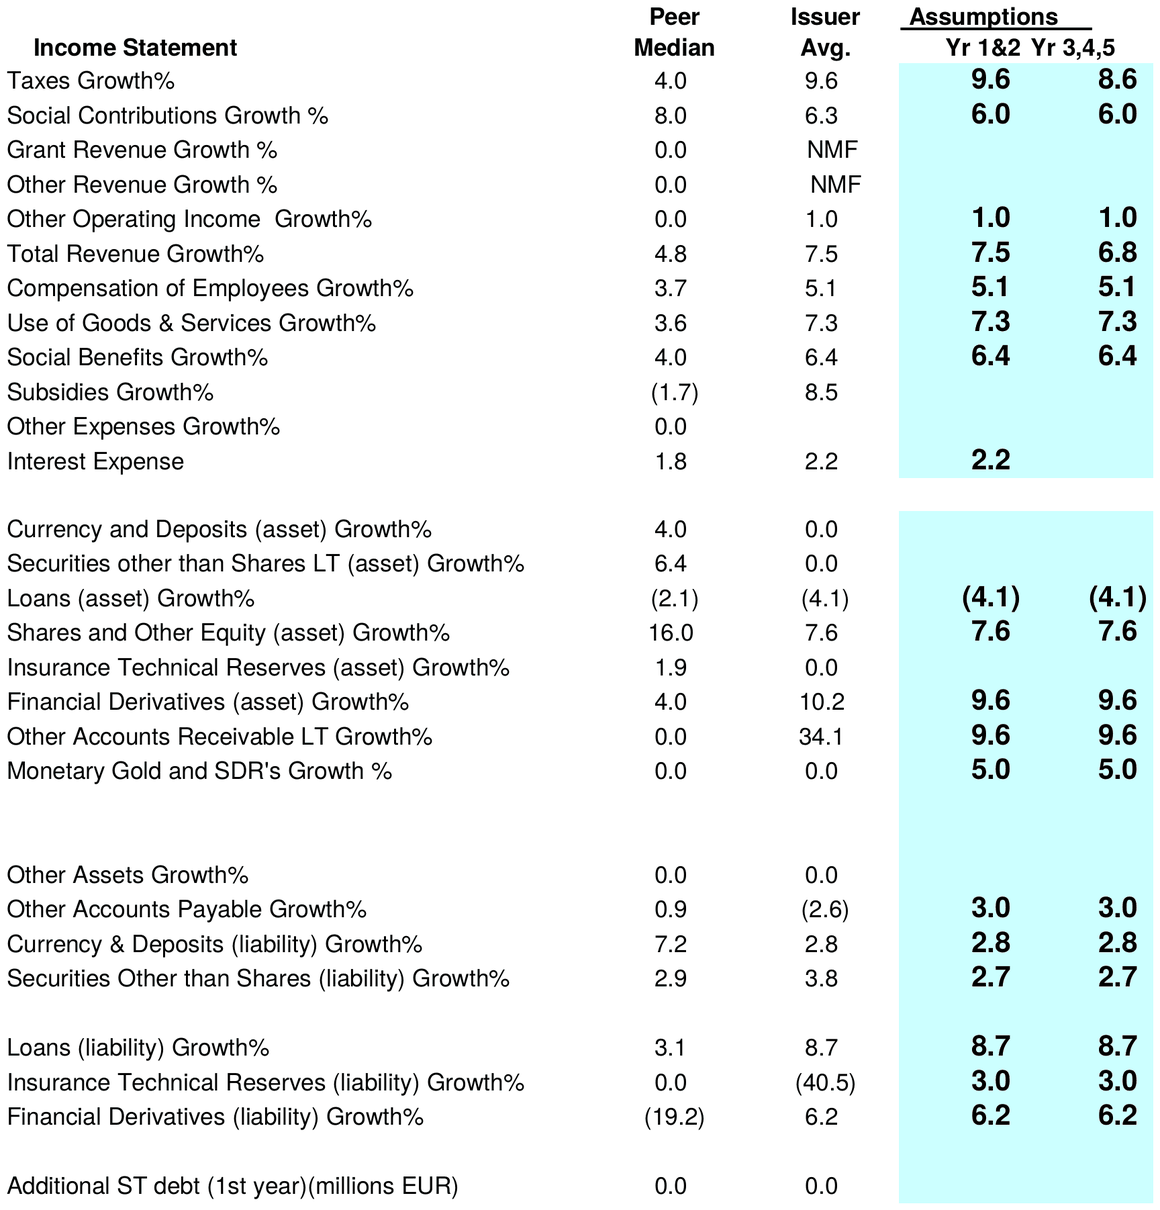
KINGDOM OF SPAIN has grown its taxes of 9.6% per annum in the last fiscal year which is more than the average for its peers. We expect tax revenues will grow approximately 9.6% per annum over the next couple of years and 8.6% per annum for the next couple of years thereafter.
Credit Quality Driver: Total Revenue Growth
KINGDOM OF SPAIN's total revenue growth has been more than its peers and we assumed no growth in total revenue over the next two years.
Annual Income Statements
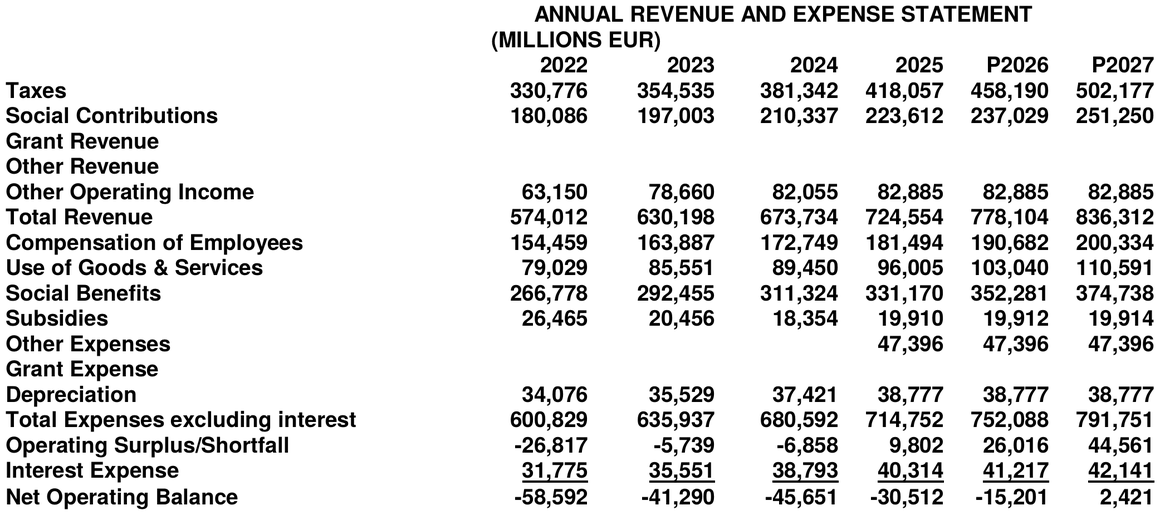
Below are KINGDOM OF SPAIN's annual income statements with the projected years based on the assumptions listed in the credit quality driver section.
Annual Balance Sheets
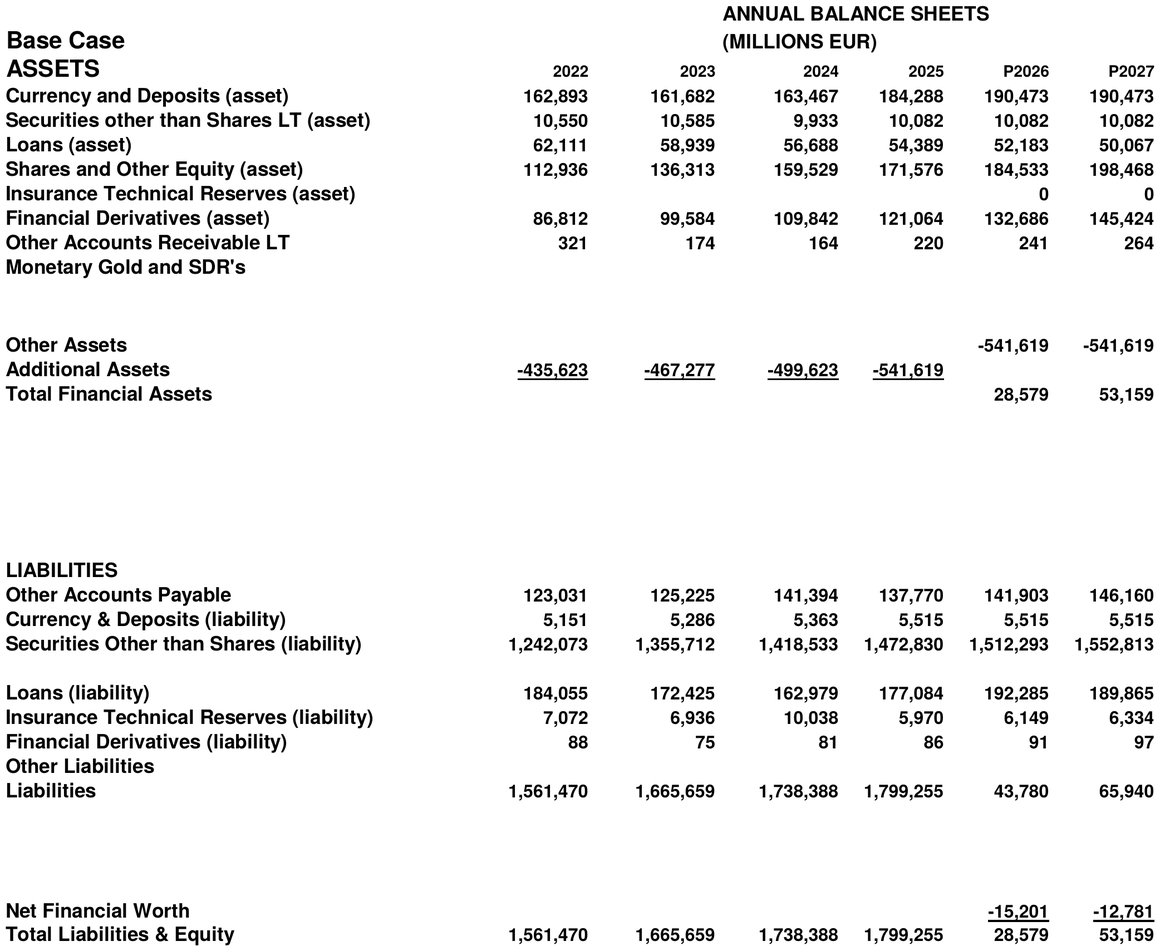
Below are KINGDOM OF SPAIN's balance sheets with the projected years based on the assumptions listed in the credit quality driver section.
Comments on the Difference between the Model and Assigned Rating
In this case, there has been little change in the recent results and therefore we have used our best judgement in making adjustments which are reflected in the results for the projected ratings. We have assigned a rating of "BBB+" whereas the ratio-implied rating for the most recent period is "A-"; the median rating for the peers is significantly higher than the issuer's rating.
Changes in Indicative Ratios
We have not made any adjustment in the indicative ratios at this time.
SEC Rule 17g-7(a) Disclosure
Below are the disclosures as required by Paragraph (a) of Rule 17g-7.
1. The symbol in the rating scale used to denote the credit rating categories and notches within categories and the identity of the obligor, security, or money market instrument as required by Paragraph (a)(1)(ii)(A) of Rule 17g-7:
For the issuer KINGDOM OF SPAIN with the ticker of 1841z SM we have assigned the senior unsecured rating of BBB+. There are three notches in our rating categories (e.g., A-, A, and A+) other than those deep into speculative grade; for CC, C, and D there are no notches.
2. The version of the procedure or methodology used to determine the credit rating as required by Paragraph (a)(1)(ii)(B) of Rule 17g-7:
We are using the methodology version #16 available via egan-jones.com under the tab at the bottom of the page "Methodologies".
3. The main assumptions and principles used in constructing the procedures and methodologies used to determine the credit rating as required by Paragraph (a)(1)(ii)(C) of Rule 17g-7:
The credit rating assigned reflects our judgement regarding the future credit quality of the issuer. Regarding the specific assumptions used, please refer to the credit quality driver section of this Rating Analysis Report.
4. The potential limitations of the credit rating as required by Paragraph (a)(1)(ii)(D) of Rule 17g-7:
Our rating pertains solely to our view of current and prospective credit quality. Our rating does not address pricing, liquidity, or other risks associated with holding investments in the issuer.
5. Information on the uncertainty of the credit rating as required by Paragraph (a)(1)(ii)(E) of Rule 17g-7:
Our rating is dependant on numerous factors including the reliability, accuracy, and quality of the data relied used in determining the credit rating. The data is sourced from publicly-available 10Q and 10K statements, quarterly reports, 8K filings, earnings reports, and other similar sources. In some cases, the information is limited because of issues such as short operating histories, the lack of reported data, a delay in reporting data, restatements, inaccurate accounting, and other issues. Such shortcomings are not always readily apparent. Egan-Jones aims to identify such shortcomings and make adjustments using its best judgement.
6. Whether and to what extent third-party due diligence services have been used in taking the rating action as required by Paragraph (a)(1)(ii)(F) of Rule 17g-7:
Egan-Jones does not utilize third-party due diligence services.
7. How servicer or remittance reports were used, and with what frequency, to conduct surveillance of the credit rating as required by Paragraph (a)(1)(ii)(G) of Rule 17g-7:
Servicer or remittance reports normally pertain to structured finance issuers; this report does not pertain to a structured finance issuer (Egan-Jones is not an NRSRO for structured finance or sovereigns/ municipal issuers). Regarding surveillance, the minimum time period for corporation issuers is normally one year.
8. A description of the data that were relied upon for the purpose of determining the credit rating as required by Paragraph (a)(1)(ii)(H) of Rule 17g-7:
Egan-Jones uses 10Q and 10K statements, quarterly reports, 8K filings, earnings reports, governmental filings and other similar sources for ratings on publicly-traded issuers. In the case of private issuers, Egan-Jones relies on information provided mainly by issuers.
9. A statement containing an overall assessment of the quality of information available and considered in the credit rating as required by Paragraph (a)(1)(ii)(I) of Rule 17g-7:
The information is generally high quality and readily avail.
10. Information relating to conflicts of interest as required by Paragraph (a)(1)(ii)(J) of Rule 17g-7:
This rating is unsolicited.
11. An explanation or measure of the potential volatility of the credit rating as required by Paragraph (a)(1)(ii)(K) of Rule 17g-7:
Our rating aims to assess the probability of the payment of obligations in full and on-time. Factors which affect such probability, and in turn our rating, include changes in the operating performance of the issuer, changes in capital structure, and merger and acquisition events.
12. Information on the content of the credit rating as required by Paragraph (a)(1)(ii)(L) of Rule 17g-7:
Regarding the historical performance of the credit rating, our rating transition matrix is available in our Form NRSRO, exhibit 1. The expected probability of default and the expected loss in the event of default is listed on the first page of this report.
13. Information on the sensitivity of the credit rating to assumptions as required by Paragraph (a)(1)(ii)(M) of Rule 17g-7:
Below is a summary of the impact of the 5 assumptions which independently would have the greatest impact on our "ratio-implied rating":

14. If the credit rating is assigned to an asset-backed security, a description of: (i) the representations, warranties, and enforcement mechanisms available to investors; and (ii) how they differ from the representations, warranties, and enforcement mechanisms in issuances of similar securities, as required by Paragraph (a)(1)(ii)(N) of Rule 17g-7:
This credit rating is not assigned to an asset-backed security.
Attestation Form
In compliance with the US Securities and Exchange Commission (SEC) Rule 17g-7(a), the Egan-Jones analyst who published the report is responsible for the rating action and to the best knowledge of the person:
1) No part of the credit rating was influenced by any other business activities,
2) The credit rating was based solely upon the merits of the obligor, security, or money market instrument being rated, and
3) The credit rating was an independent evaluation of the credit risk of the obligor, security, or money market instrument.
Sovereign Rating Methodology (Non-NRSRO)
Scope and Limitations: Sovereign Issuer Credit Quality Ratings (CQR) are a forward-looking assessment of a sovereign's capacity and willingness to honor its existing and future obligations in full and on time. Sovereigns are assigned two CQRs: a Local-Currency CQR, which reflects the likelihood of default on debt issued and payable in the currency of the sovereign, and a Foreign-Currency CQR, which is an assessment of the credit risk associated with debt issued and payable in foreign currencies.Key Rating Drivers: Egan-Jones' approach to sovereign risk analysis is a synthesis of quantitative and qualitative judgments. The quantitative factors Egan-Jones uses are:
- Debt in relation to GDP. - Surplus or deficit in relation to GDP. - Debt plus potential under-funding of major banks in relation to GDP. - Interest expense in relation to taxes. - GDP growth. - Foreign reserves in relation to debt.
Debt levels for many sovereign issuers have increased at an accelerating rate over the past decade, affecting implied ratings. Egan-Jones also considers unemployment levels and funding costs. Egan-Jones recognizes that no model can fully capture all the relevant influences on sovereign creditworthiness, meaning that its sovereign ratings can and do differ from those implied by the rating model. Some of the qualitative factors that impact its ultimate assessment of credit quality include the flexibility, stability and overall strength of the economy, efficiency of tax collection, acceptance of contract law, ease of doing business, trade balances, prospects for future growth and health and monetary policy, and economic freedom. These subjective and dynamic qualitative issues are not captured by the model but affect sovereign ratings
For additional information, please see Exhibit 2: Methodologies in Egan-Jones' Form NRSRO.
Copyright ©2026, Egan-Jones Ratings Company, Inc. (“Egan-Jones”). All rights reserved. The information upon which Egan-Jones ratings and reports are based is obtained by Egan-Jones from sources Egan-Jones believes to be accurate and reliable. Egan-Jones relies on third party reports and information and data provided and Egan-Jones has not, unless required by law or internal policies/procedures, independently verified or performed due diligence related to the accuracy of information, data or reports. Egan-Jones has not consented to, nor will consent to, being named an “expert” under federal securities laws, including without limitation, Section 7 of the Securities Act of 1933. Please note that expected or final ratings are not recommendations to buy, hold or sell the securities. Egan-Jones is not an advisor and is not providing investment advice, strategy or related services. Egan-Jones and its third-party suppliers (“Suppliers”) hereby disclaim any representation or warranty, express or implied, as to the accuracy, timeliness, completeness, merchantability, and fitness for any particular purpose or non-infringement of any of such information. In no event shall Egan-Jones or its directors, officers, employees, independent contractors, agents, representatives, or Suppliers (collectively, Egan-Jones Representatives) be liable (1) for any inaccuracy, delay, loss of data, interruption in service, error. (negligent or otherwise) or other circumstance or contingency within or outside the control of Egan-Jones or any Egan-Jones Representative, in connection with or related to obtaining, collecting, compiling, analyzing, interpreting, communicating, publishing or delivering any such information. Ratings and other opinions issued by Egan-Jones are, and must be construed solely as, statements of opinion and not statements of fact as to credit worthiness or recommendations to purchase, sell or hold any securities. A report providing an Egan-Jones rating is neither a prospectus nor a substitute for the information assembled, verified and presented to investors by the issuer and its agents in connection with the sale of the securities. Egan-Jones is not responsible for the content or operation of third party websites accessed through hypertext or other computer links and Egan-Jones shall have no liability to any person or entity for the use of such third party websites. This publication may not be reproduced, retransmitted or distributed in any form without the prior written consent of Egan-Jones. Egan-Jones ratings are subject to disclaimers. Egan-Jones is not an NRSRO (as defined by the SEC) for sovereign/municipal issuers and structured finance/ABS issuers.
Sources and Footnotes
1. TMT Finance, “2026 hyperscaler capex tops US$700bn - analysis”, August 18, 2026, covering Microsoft, Alphabet, Amazon and Meta guidance after second-quarter results. The same analysis reports Alphabet’s debt rising from about $16 billion a year earlier to roughly $100 billion. 2. Pluribus News via Arizona Capitol Times, “AI super PACs flood money into state elections”, August 16, 2026. Leading the Future is a $140 million pro-AI super PAC network whose key funders include Andreessen Horowitz and OpenAI president Greg Brockman. It mounted an $8 million campaign against New York Assemblymember Alex Bores, sponsor of the RAISE Act, who came in a close second in the June primary in New York’s 12th District. 3. Gallup, Jeffrey M. Jones, “Americans Oppose AI Data Centers in Their Area”, May 13, 2026. Survey of 1,000 adults, March 2-18, 2026. 4. Gallup, “Big Pharma Sinks to the Bottom of U.S. Industry Rankings”, 2019, when pharma ranked last of 25 industries, and “Retail, Pharmaceutical Industries Slip in Public Esteem”, September 13, 2023. 5. The Fulcrum, “Pharma Industry and Ballard Partners Dominate the Lobbying Space in Second Quarter of 2025”, August 5, 2025, reporting an OpenSecrets analysis. The pharmaceutical and health products industry has outspent every other industry in every quarter but one since 2010, and spent $226.8 million in the first half of 2025. 6. CNBC, “Trump calls for Congress to enact 10% credit card interest rate cap; bank stocks rise”, January 21, 2026. Bill status per GovTrack (S. 381, introduced February 4, 2025). 7. Pew Research Center, “Americans increasingly see legal sports betting as a bad thing for society and sports”, October 2, 2025. Survey of 9,916 adults, July 8 to August 3, 2025. 8. Public Citizen, “Corporate Supremacist Super PACs Drive $500 Million Midterm Spending Surge”, June 30, 2026, using FEC data through the first quarter of 2026. 9. Issue One, “Big Tech Spends Millions to Buy Influence in Washington in First Half of 2026”, July 21, 2026. Eleven of the largest tech, social media and AI companies and their leading trade associations spent $38 million in the first half of 2025 and $41 million in the first half of 2026. 10. NBC News, “House passes bill to shield consumers from data center price hikes on energy”, September 16, 2026. The only opposition came from progressive Reps. Summer Lee, Delia Ramirez and Rashida Tlaib; Tlaib called for a national moratorium. The bill requires states to consider standards for large loads to cover the cost of serving them (Utility Dive); it awaits Senate action. 11. Texas Tribune, “Gov. Greg Abbott broadens moratorium on data center approvals to include environmental permits”, September 21, 2026. 12. CalMatters, “What to know about 7 new data center laws Gavin Newsom signed”, September 2026. Three of the laws shift electric infrastructure costs toward data center operators, three require disclosure of water and other resource use, and one removes environmental review exemptions. 13. WUSF, “DeSantis signs bill adding regulations for ‘hyper-scale’ AI data centers”, May 7, 2026, on SB 484. 14. Florida Phoenix via Route Fifty, “Florida has a new law regulating AI data centers”, May 8, 2026: the House rewrote the bill after conversations with the White House, and the final law was less expansive than DeSantis sought. 15. OpenAI, “PRC-linked influence operations are targeting AI debates in the US”, June 2026, and its “Data Center Bandwagon” case study. 16. Axios, “America’s data center revolt is getting a boost from China-linked bots”, August 28, 2026: X’s Safety team identified a bot farm of about 200,000 accounts, 200 of them posting on American AI and energy policy. The Next Web, “X said Chinese bots fuelled the data centre backlash. A researcher checked”, September 1, 2026, citing Clemson University researcher Darren Linvill via Business Insider: the posts date from January, and each account was suspended after two or three posts. 17. Bloomberg via Insurance Journal, “Oracle Cites ‘Force Majeure’ on Controversial New Mexico Data Center”, September 25, 2026. Oracle sent Blue Owl’s Stack Infrastructure a force majeure notice; about 20 banks provided the $18 billion construction loan; an Energy Transfer gas pipeline for the site slipped to February 1, 2027 after repeated permit denials; and the report notes the questions the notice raises about the resilience of data center leases. 18. CNBC, “Texas Gov. Abbott orders data center permit halt weeks after issuing moratorium”, September 21, 2026, citing Data Center Watch.
Additional Sources
- Associated Press via PBS NewsHour, “Ocasio-Cortez and Sanders push bill to impose AI data center moratorium”, March 25, 2026. - Bannon’s backing of the Sanders and Ocasio-Cortez proposal, as reported by the Wall Street Journal and summarized by the Jerusalem Post. Hawley’s questioning of the buildout per Mother Jones, March 25, 2026. - Office of Senator Bernie Sanders, “Sanders, Takano Reintroduce Bill to Move Toward 32-Hour Workweek, Ensure America’s Workers Benefit from AI and Automation”, September 8, 2026. - Reason, “Data centers use less water than almond farms - and do more good”, May 20, 2026, quoting Josh Eakle’s Substack; it also puts US golf courses at 1.4 billion gallons a day. - Axios, “Exclusive poll: Here are the concerns about data centers”, April 3, 2026, on the Harvard/MIT survey overseen by Stephen Ansolabehere. - Harvard Salata Institute, “On data centers, local vibes matter more than electricity prices - poll”, April 21, 2026. Average answers on a scale from 0 (strongly oppose) to 1 (strongly support), with 0.5 neutral: e-commerce warehouse 0.61, auto factory 0.57, data center 0.51, petrochemical plant 0.37. The survey also found that perceived quality of life weighed nearly three times as much as any other factor, power bills included. - Coverage by a Chinese state broadcaster and a Communist Party newspaper blaming AI data centers for higher US energy prices, cited in a May 2026 Bitcoin Policy Institute report, as described by PolitiFact, September 23, 2026. - Freshfields, “White House Publishes AI Legislative Framework to Preempt State AI Regulation”, March 23, 2026. - Nextgov/FCW, “Lawmakers propose AI framework that would preempt state laws for 3 years”, June 4, 2026, on the bipartisan discussion draft from Reps. Jay Obernolte and Lori Trahan. - Opening image: still from the film Margin Call (2011). - Exhibit 1: Yahoo Finance, June 3, 2026: Alphabet, Amazon, Meta and Microsoft plan $725 billion of capital spending in 2026, up 77% from $410 billion in 2025. - Exhibit 2: Gallup (note 3). Party figures add the somewhat and strongly opposed shares in Gallup’s tables. - Exhibit 3: pharmaceutical and health products federal lobbying, first half of 2025 (note 5); the 11 largest tech, social media and AI companies plus their trade groups, first half of 2025 (note 9); Leading the Future funds raised for the 2026 cycle (note 2). Pharma’s $226.8 million is shown rounded to $227 million. - Exhibit 4: NBC News (note 10). - Exhibit 5: Sheppard Mullin, “Choosing Between U.S. and Chinese AI Models: The Export Control Risks on Both Sides”, July 23, 2026: Chinese models accounted for roughly 61% of tokens processed on OpenRouter in mid-2026, and the FY2026 NDAA bars the Defense Department and its contractors from using DeepSeek; also the source for Qwen’s share of new derivative models on Hugging Face. - Exhibit 6: Egan-Jones assessment drawing on notes 1, 17 and 18. - Kingdom of Spain - annual ratios, past results: International Monetary Fund (IMF). - Kingdom of Spain - GDP growth, fiscal comparison and unemployment: IMF International Financial Statistics (IFS). - Kingdom of Spain - fiscal comparison and sovereign debt yields: Thomson Reuters (LSEG Workspace). - Kingdom of Spain - World Bank, Doing Business: Spain. - Kingdom of Spain - The Heritage Foundation, 2026 Index of Economic Freedom: Spain.